Gene Page: TCTE3
Summary ?
| GeneID | 6991 |
| Symbol | TCTE3 |
| Synonyms | TCTEX1D3 |
| Description | t-complex-associated-testis-expressed 3 |
| Reference | MIM:186977|HGNC:HGNC:11695|Ensembl:ENSG00000184786|HPRD:01747|Vega:OTTHUMG00000016068 |
| Gene type | protein-coding |
| Map location | 6q27 |
| Pascal p-value | 0.641 |
| Fetal beta | 0.258 |
| DMG | 1 (# studies) |
Gene in Data Sources
| Gene set name | Method of gene set | Description | Info |
|---|---|---|---|
| CV:PGCnp | Genome-wide Association Study | GWAS | |
| DMG:Jaffe_2016 | Genome-wide DNA methylation analysis | This dataset includes 2,104 probes/CpGs associated with SZ patients (n=108) compared to 136 controls at Bonferroni-adjusted P < 0.05. | 2 |
| DMG:Wockner_2014 | Genome-wide DNA methylation analysis | This dataset includes 4641 differentially methylated probes corresponding to 2929 unique genes between schizophrenia patients (n=24) and controls (n=24). | 2 |
Section I. Genetics and epigenetics annotation
 Differentially methylated gene
| Probe | Chromosome | Position | Nearest gene | P (dis) | Beta (dis) | FDR (dis) | Study |
|---|---|---|---|---|---|---|---|
| cg18452880 | 6 | 170151829 | C6orf70;TCTE3 | 6.25E-5 | -0.488 | 0.023 | DMG:Wockner_2014 |
| cg03226425 | 6 | 170151538 | TCTE3 | 3.46E-10 | -0.02 | 7.22E-7 | DMG:Jaffe_2016 |
Section II. Transcriptome annotation
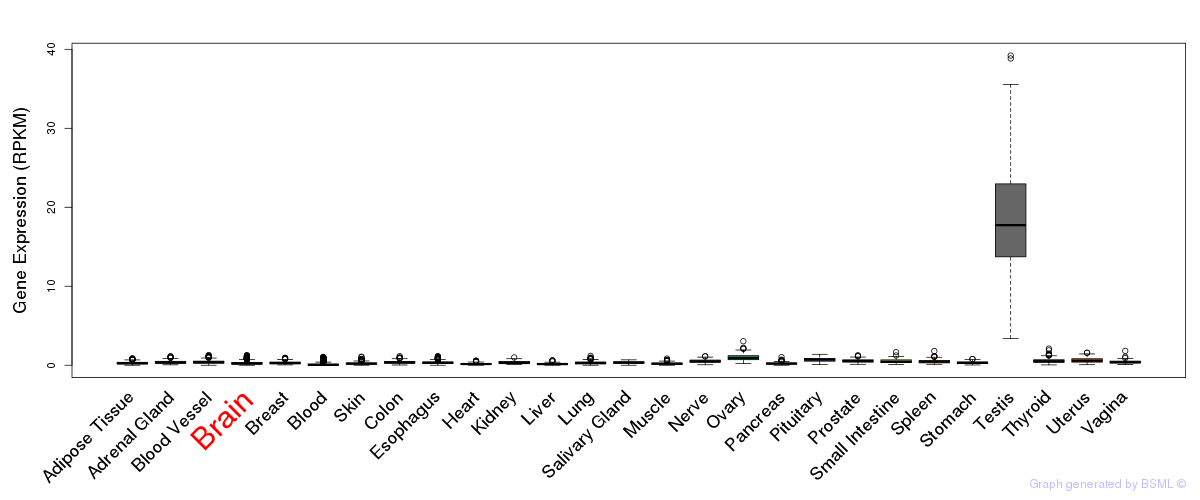
General gene expression (GTEx)
Gene expression during devlopment (BrainCloud)
Footnote:
A total of 269 time points ploted, with n=38 fetal samples (x=1:38). Each triangle represents one time point.
Gene expression of temporal and spatial changes (BrainSpan)
Footnote:
SC: sub-cortical regions; SM: sensory-motor regions; FC: frontal cortex; and TP: temporal-parietal cortex
ST1: fetal (13 - 26 postconception weeks), ST2: early infancy to late childhood (4 months to 11 years), and ST3: adolescence to adulthood (13 - 23 years)
The bar shown representes the lower 25% and upper 25% of the expression distribution.
Top co-expressed genes in brain regions
| Top 10 positively co-expressed genes | ||
| Gene | Pearson's Correlation | Spearman's Correlation |
| C9orf24 | 0.58 | 0.21 |
| PIH1D2 | 0.55 | 0.20 |
| CLEC3B | 0.54 | 0.35 |
| LRRC70 | 0.54 | 0.17 |
| C6orf52 | 0.53 | 0.22 |
| CCDC153 | 0.52 | 0.21 |
| CD36 | 0.52 | 0.23 |
| C11orf70 | 0.52 | 0.23 |
| C1orf88 | 0.52 | 0.16 |
| FAM166B | 0.51 | 0.17 |
| Top 10 negatively co-expressed genes | ||
| Gene | Pearson's Correlation | Spearman's Correlation |
| PK4P | -0.29 | -0.29 |
| FBXW4 | -0.27 | -0.23 |
| C7orf41 | -0.27 | -0.27 |
| FAM122B | -0.26 | -0.28 |
| WASF3 | -0.26 | -0.27 |
| ASRGL1 | -0.26 | -0.27 |
| HERC2P2 | -0.26 | -0.24 |
| MAFK | -0.26 | -0.22 |
| MAN2A2 | -0.25 | -0.26 |
| MAP4 | -0.25 | -0.21 |
Section V. Pathway annotation
| Pathway name | Pathway size | # SZGR 2.0 genes in pathway | Info |
|---|---|---|---|
| ZHOU INFLAMMATORY RESPONSE LIVE UP | 485 | 293 | All SZGR 2.0 genes in this pathway |
| MARSON BOUND BY FOXP3 STIMULATED | 1022 | 619 | All SZGR 2.0 genes in this pathway |
| KONDO EZH2 TARGETS | 245 | 148 | All SZGR 2.0 genes in this pathway |
| BOYLAN MULTIPLE MYELOMA C D UP | 139 | 95 | All SZGR 2.0 genes in this pathway |
| PHESSE TARGETS OF APC AND MBD2 UP | 20 | 14 | All SZGR 2.0 genes in this pathway |