Gene Page: TPTE
Summary ?
| GeneID | 7179 |
| Symbol | TPTE |
| Synonyms | CT44|PTEN2 |
| Description | transmembrane phosphatase with tensin homology |
| Reference | MIM:604336|HGNC:HGNC:12023|Ensembl:ENSG00000274391|HPRD:05064|Vega:OTTHUMG00000074127 |
| Gene type | protein-coding |
| Map location | 21p11 |
| Fetal beta | -0.44 |
| eGene | Myers' cis & trans |
Gene in Data Sources
| Gene set name | Method of gene set | Description | Info |
|---|---|---|---|
| CV:GWAScat | Genome-wide Association Studies | This data set includes 560 SNPs associated with schizophrenia. A total of 486 genes were mapped to these SNPs within 50kb. | |
| CV:GWASdb | Genome-wide Association Studies | GWASdb records for schizophrenia | |
| PMID:cooccur | High-throughput literature-search | Systematic search in PubMed for genes co-occurring with SCZ keywords. A total of 3027 genes were included. | |
| Literature | High-throughput literature-search | Co-occurance with Schizophrenia keywords: schizophrenia,schizophrenias | Click to show details |
Section I. Genetics and epigenetics annotation
 eQTL annotation
| SNP ID | Chromosome | Position | eGene | Gene Entrez ID | pvalue | qvalue | TSS distance | eQTL type |
|---|---|---|---|---|---|---|---|---|
| rs11682393 | chr2 | 47804496 | TPTE | 7179 | 0.15 | trans |
Section II. Transcriptome annotation
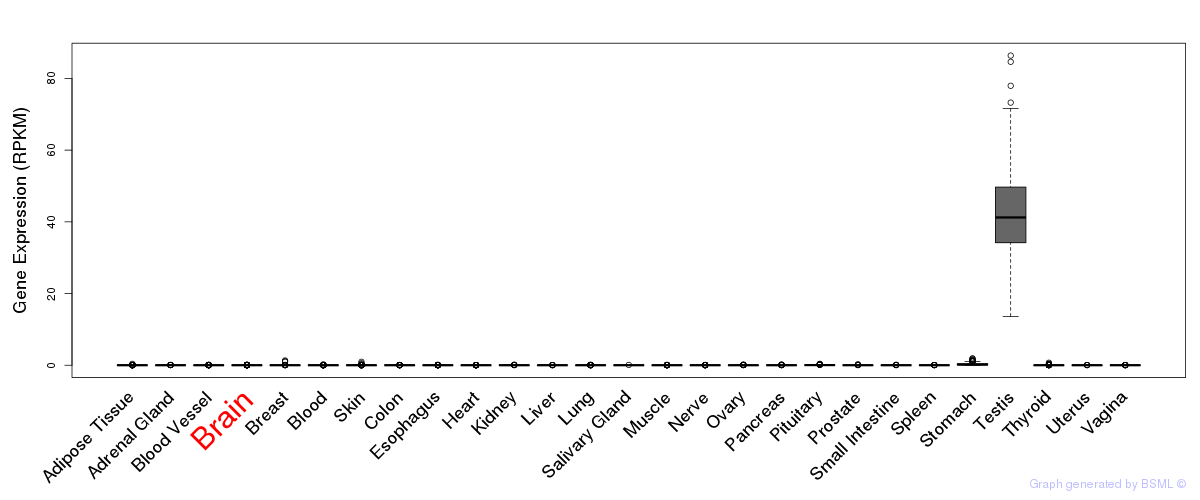
General gene expression (GTEx)
Gene expression during devlopment (BrainCloud)
Footnote:
A total of 269 time points ploted, with n=38 fetal samples (x=1:38). Each triangle represents one time point.
Gene expression of temporal and spatial changes (BrainSpan)
Footnote:
SC: sub-cortical regions; SM: sensory-motor regions; FC: frontal cortex; and TP: temporal-parietal cortex
ST1: fetal (13 - 26 postconception weeks), ST2: early infancy to late childhood (4 months to 11 years), and ST3: adolescence to adulthood (13 - 23 years)
The bar shown representes the lower 25% and upper 25% of the expression distribution.
Top co-expressed genes in brain regions
| Top 10 positively co-expressed genes | ||
| Gene | Pearson's Correlation | Spearman's Correlation |
| C1orf127 | 0.79 | 0.34 |
| PAPPA | 0.74 | 0.44 |
| CIT | 0.73 | 0.50 |
| PTPN3 | 0.73 | 0.46 |
| TUBA8 | 0.72 | 0.39 |
| GRM4 | 0.72 | 0.65 |
| INPP5A | 0.72 | 0.70 |
| BTBD11 | 0.72 | 0.43 |
| PCP4 | 0.72 | 0.36 |
| VWC2 | 0.71 | 0.45 |
| Top 10 negatively co-expressed genes | ||
| Gene | Pearson's Correlation | Spearman's Correlation |
| WDR86 | -0.23 | -0.13 |
| AL139819.3 | -0.22 | -0.45 |
| AF347015.2 | -0.21 | -0.37 |
| FAM159B | -0.20 | -0.34 |
| PLAC9 | -0.20 | -0.38 |
| FTHL16 | -0.20 | -0.19 |
| C2orf84 | -0.20 | -0.19 |
| AF347015.21 | -0.19 | -0.38 |
| AP000679.1 | -0.19 | -0.32 |
| EMX2 | -0.19 | -0.35 |
Section V. Pathway annotation
| Pathway name | Pathway size | # SZGR 2.0 genes in pathway | Info |
|---|---|---|---|
| KIM WT1 TARGETS DN | 459 | 276 | All SZGR 2.0 genes in this pathway |
| RODRIGUES THYROID CARCINOMA ANAPLASTIC UP | 722 | 443 | All SZGR 2.0 genes in this pathway |
| BLALOCK ALZHEIMERS DISEASE UP | 1691 | 1088 | All SZGR 2.0 genes in this pathway |
| YEGNASUBRAMANIAN PROSTATE CANCER | 128 | 60 | All SZGR 2.0 genes in this pathway |
| WEBER METHYLATED HCP IN FIBROBLAST DN | 42 | 22 | All SZGR 2.0 genes in this pathway |
| WEBER METHYLATED HCP IN SPERM UP | 20 | 13 | All SZGR 2.0 genes in this pathway |
| CHEN HOXA5 TARGETS 9HR UP | 223 | 132 | All SZGR 2.0 genes in this pathway |