Gene Page: BEST1
Summary ?
| GeneID | 7439 |
| Symbol | BEST1 |
| Synonyms | ARB|BEST|BMD|RP50|TU15B|VMD2 |
| Description | bestrophin 1 |
| Reference | MIM:607854|HGNC:HGNC:12703|Ensembl:ENSG00000167995|HPRD:01094|Vega:OTTHUMG00000167469 |
| Gene type | protein-coding |
| Map location | 11q13 |
| Pascal p-value | 0.652 |
| Sherlock p-value | 0.388 |
| DEG p-value | DEG:Zhao_2015:p=9.83e-05:q=0.0693 |
| eGene | Meta |
Gene in Data Sources
| Gene set name | Method of gene set | Description | Info |
|---|---|---|---|
| CV:PGCnp | Genome-wide Association Study | GWAS | |
| DEG:Zhao_2015 | RNA Sequencing analysis | Transcriptome sequencing and genome-wide association analyses reveal lysosomal function and actin cytoskeleton remodeling in schizophrenia and bipolar disorder. |
Section I. Genetics and epigenetics annotation
Section II. Transcriptome annotation
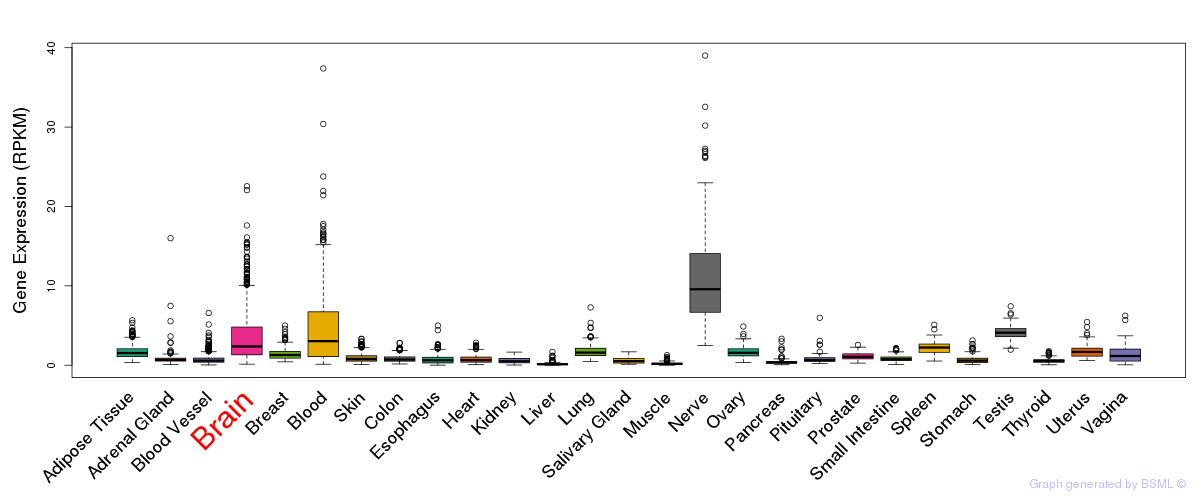
General gene expression (GTEx)
Gene expression of temporal and spatial changes (BrainSpan)
Footnote:
SC: sub-cortical regions; SM: sensory-motor regions; FC: frontal cortex; and TP: temporal-parietal cortex
ST1: fetal (13 - 26 postconception weeks), ST2: early infancy to late childhood (4 months to 11 years), and ST3: adolescence to adulthood (13 - 23 years)
The bar shown representes the lower 25% and upper 25% of the expression distribution.
Top co-expressed genes in brain regions
| Top 10 positively co-expressed genes | ||
| Gene | Pearson's Correlation | Spearman's Correlation |
| TPBG | 0.67 | 0.68 |
| C3orf58 | 0.62 | 0.59 |
| ACTN1 | 0.62 | 0.69 |
| RAP1GAP | 0.60 | 0.70 |
| CCNO | 0.59 | 0.53 |
| WDR42A | 0.59 | 0.72 |
| ADCY3 | 0.59 | 0.67 |
| PPP1R16B | 0.58 | 0.59 |
| ABLIM2 | 0.58 | 0.69 |
| RP5-1187M17.1 | 0.58 | 0.69 |
| Top 10 negatively co-expressed genes | ||
| Gene | Pearson's Correlation | Spearman's Correlation |
| AF347015.18 | -0.30 | -0.23 |
| AF347015.21 | -0.30 | -0.24 |
| DBI | -0.29 | -0.38 |
| IL32 | -0.27 | -0.30 |
| AF347015.2 | -0.26 | -0.18 |
| BTBD17 | -0.25 | -0.37 |
| ANP32C | -0.25 | -0.32 |
| AF347015.8 | -0.25 | -0.20 |
| AF347015.31 | -0.25 | -0.22 |
| MT-ATP8 | -0.25 | -0.20 |
Section V. Pathway annotation
| Pathway name | Pathway size | # SZGR 2.0 genes in pathway | Info |
|---|---|---|---|
| MULLIGHAN MLL SIGNATURE 2 UP | 418 | 263 | All SZGR 2.0 genes in this pathway |
| DARWICHE SKIN TUMOR PROMOTER DN | 185 | 115 | All SZGR 2.0 genes in this pathway |
| DARWICHE PAPILLOMA RISK LOW DN | 165 | 107 | All SZGR 2.0 genes in this pathway |
| DARWICHE PAPILLOMA RISK HIGH DN | 180 | 110 | All SZGR 2.0 genes in this pathway |
| DARWICHE SQUAMOUS CELL CARCINOMA UP | 146 | 104 | All SZGR 2.0 genes in this pathway |
| PEART HDAC PROLIFERATION CLUSTER DN | 76 | 57 | All SZGR 2.0 genes in this pathway |
| BLALOCK ALZHEIMERS DISEASE UP | 1691 | 1088 | All SZGR 2.0 genes in this pathway |
| MAHAJAN RESPONSE TO IL1A UP | 81 | 52 | All SZGR 2.0 genes in this pathway |
| VERHAAK GLIOBLASTOMA NEURAL | 129 | 85 | All SZGR 2.0 genes in this pathway |
| FOSTER KDM1A TARGETS UP | 266 | 142 | All SZGR 2.0 genes in this pathway |