Gene Page: CLIP2
Summary ?
| GeneID | 7461 |
| Symbol | CLIP2 |
| Synonyms | CLIP|CLIP-115|CYLN2|WBSCR3|WBSCR4|WSCR3|WSCR4 |
| Description | CAP-Gly domain containing linker protein 2 |
| Reference | MIM:603432|HGNC:HGNC:2586|Ensembl:ENSG00000106665|HPRD:09140|Vega:OTTHUMG00000022980 |
| Gene type | protein-coding |
| Map location | 7q11.23 |
| Pascal p-value | 0.744 |
| Sherlock p-value | 0.375 |
| Fetal beta | -0.182 |
| eGene | Meta |
| Support | G2Cdb.human_BAYES-COLLINS-HUMAN-PSD-CONSENSUS G2Cdb.human_BAYES-COLLINS-HUMAN-PSD-FULL G2Cdb.human_BAYES-COLLINS-MOUSE-PSD-CONSENSUS |
Gene in Data Sources
| Gene set name | Method of gene set | Description | Info |
|---|---|---|---|
| CNV:YES | Copy number variation studies | Manual curation | |
| CV:PGCnp | Genome-wide Association Study | GWAS |
Section I. Genetics and epigenetics annotation
Section II. Transcriptome annotation
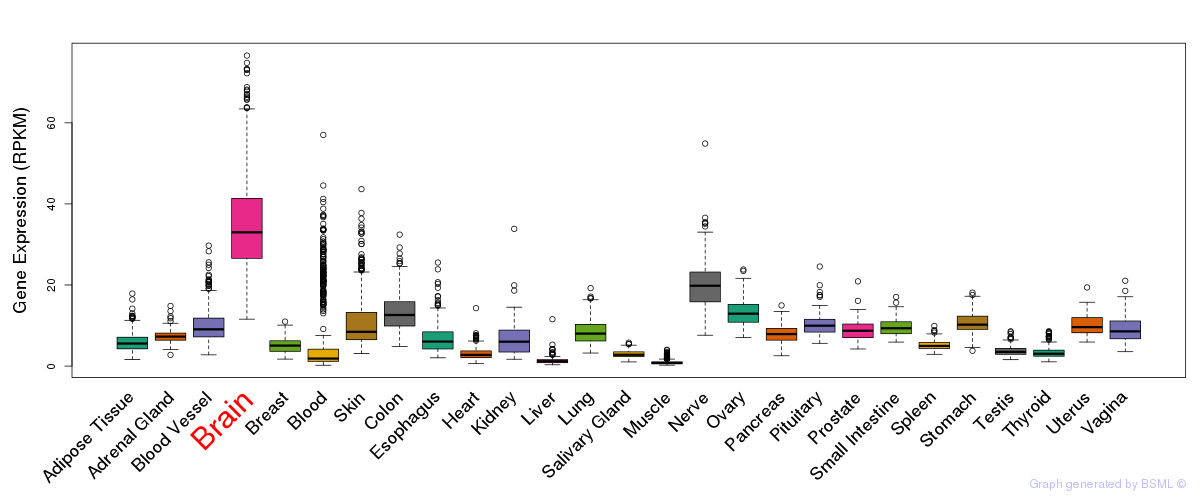
General gene expression (GTEx)
Gene expression during devlopment (BrainCloud)
Footnote:
A total of 269 time points ploted, with n=38 fetal samples (x=1:38). Each triangle represents one time point.
Gene expression of temporal and spatial changes (BrainSpan)
Footnote:
SC: sub-cortical regions; SM: sensory-motor regions; FC: frontal cortex; and TP: temporal-parietal cortex
ST1: fetal (13 - 26 postconception weeks), ST2: early infancy to late childhood (4 months to 11 years), and ST3: adolescence to adulthood (13 - 23 years)
The bar shown representes the lower 25% and upper 25% of the expression distribution.
Top co-expressed genes in brain regions
| Top 10 positively co-expressed genes | ||
| Gene | Pearson's Correlation | Spearman's Correlation |
| SYNJ1 | 0.91 | 0.91 |
| NAPB | 0.91 | 0.93 |
| NSF | 0.91 | 0.92 |
| REPS2 | 0.91 | 0.86 |
| GLS | 0.90 | 0.90 |
| B4GALT6 | 0.90 | 0.92 |
| NCOA7 | 0.90 | 0.89 |
| ATP6V1C1 | 0.90 | 0.88 |
| MAP2K4 | 0.90 | 0.88 |
| UHMK1 | 0.90 | 0.89 |
| Top 10 negatively co-expressed genes | ||
| Gene | Pearson's Correlation | Spearman's Correlation |
| BCL7C | -0.46 | -0.50 |
| GTF3C6 | -0.41 | -0.36 |
| SNHG12 | -0.41 | -0.45 |
| NME4 | -0.41 | -0.49 |
| C9orf46 | -0.40 | -0.36 |
| RPL23A | -0.40 | -0.39 |
| C21orf57 | -0.40 | -0.37 |
| EFEMP2 | -0.39 | -0.41 |
| RAB13 | -0.39 | -0.45 |
| AC006276.2 | -0.39 | -0.34 |
Section V. Pathway annotation
| Pathway name | Pathway size | # SZGR 2.0 genes in pathway | Info |
|---|---|---|---|
| CHARAFE BREAST CANCER LUMINAL VS MESENCHYMAL DN | 460 | 312 | All SZGR 2.0 genes in this pathway |
| GARGALOVIC RESPONSE TO OXIDIZED PHOSPHOLIPIDS TURQUOISE UP | 79 | 50 | All SZGR 2.0 genes in this pathway |
| GRAESSMANN APOPTOSIS BY DOXORUBICIN DN | 1781 | 1082 | All SZGR 2.0 genes in this pathway |
| RIZ ERYTHROID DIFFERENTIATION 6HR | 40 | 23 | All SZGR 2.0 genes in this pathway |
| SEITZ NEOPLASTIC TRANSFORMATION BY 8P DELETION DN | 30 | 25 | All SZGR 2.0 genes in this pathway |
| BUYTAERT PHOTODYNAMIC THERAPY STRESS UP | 811 | 508 | All SZGR 2.0 genes in this pathway |
| SUNG METASTASIS STROMA UP | 110 | 70 | All SZGR 2.0 genes in this pathway |
| ROSS ACUTE MYELOID LEUKEMIA CBF | 82 | 57 | All SZGR 2.0 genes in this pathway |
| PARK HSC VS MULTIPOTENT PROGENITORS UP | 19 | 14 | All SZGR 2.0 genes in this pathway |
| YAGI AML RELAPSE PROGNOSIS | 35 | 24 | All SZGR 2.0 genes in this pathway |
| MANALO HYPOXIA UP | 207 | 145 | All SZGR 2.0 genes in this pathway |
| YAGI AML SURVIVAL | 129 | 87 | All SZGR 2.0 genes in this pathway |
| BLALOCK ALZHEIMERS DISEASE UP | 1691 | 1088 | All SZGR 2.0 genes in this pathway |
| HELLER SILENCED BY METHYLATION UP | 282 | 183 | All SZGR 2.0 genes in this pathway |
| HELLER HDAC TARGETS SILENCED BY METHYLATION UP | 461 | 298 | All SZGR 2.0 genes in this pathway |
| VALK AML CLUSTER 9 | 35 | 26 | All SZGR 2.0 genes in this pathway |
| VERHAAK GLIOBLASTOMA CLASSICAL | 162 | 122 | All SZGR 2.0 genes in this pathway |
| KOINUMA TARGETS OF SMAD2 OR SMAD3 | 824 | 528 | All SZGR 2.0 genes in this pathway |
| PHONG TNF RESPONSE NOT VIA P38 | 337 | 236 | All SZGR 2.0 genes in this pathway |
| ZWANG TRANSIENTLY UP BY 2ND EGF PULSE ONLY | 1725 | 838 | All SZGR 2.0 genes in this pathway |