Gene Page: NPHS2
Summary ?
| GeneID | 7827 |
| Symbol | NPHS2 |
| Synonyms | PDCN|SRN1 |
| Description | NPHS2 podocin |
| Reference | MIM:604766|HGNC:HGNC:13394|Ensembl:ENSG00000116218|HPRD:05303|Vega:OTTHUMG00000035252 |
| Gene type | protein-coding |
| Map location | 1q25.2 |
| Fetal beta | -0.624 |
| DMG | 1 (# studies) |
Gene in Data Sources
| Gene set name | Method of gene set | Description | Info |
|---|---|---|---|
| CV:PGCnp | Genome-wide Association Study | GWAS | |
| DMG:Nishioka_2013 | Genome-wide DNA methylation analysis | The authors investigated the methylation profiles of DNA in peripheral blood cells from 18 patients with first-episode schizophrenia (FESZ) and from 15 normal controls. | 1 |
Section I. Genetics and epigenetics annotation
 Differentially methylated gene
| Probe | Chromosome | Position | Nearest gene | P (dis) | Beta (dis) | FDR (dis) | Study |
|---|---|---|---|---|---|---|---|
| cg23045073 | 1 | 179545458 | NPHS2 | -0.021 | 0.71 | DMG:Nishioka_2013 |
Section II. Transcriptome annotation
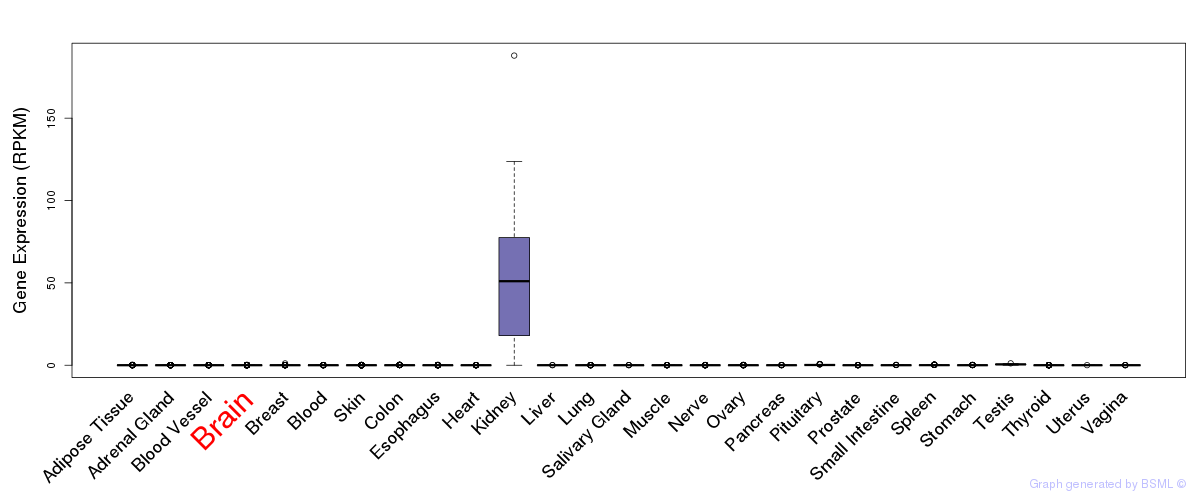
General gene expression (GTEx)
Gene expression during devlopment (BrainCloud)
Footnote:
A total of 269 time points ploted, with n=38 fetal samples (x=1:38). Each triangle represents one time point.
Gene expression of temporal and spatial changes (BrainSpan)
Footnote:
SC: sub-cortical regions; SM: sensory-motor regions; FC: frontal cortex; and TP: temporal-parietal cortex
ST1: fetal (13 - 26 postconception weeks), ST2: early infancy to late childhood (4 months to 11 years), and ST3: adolescence to adulthood (13 - 23 years)
The bar shown representes the lower 25% and upper 25% of the expression distribution.
Top co-expressed genes in brain regions
| Top 10 positively co-expressed genes | ||
| Gene | Pearson's Correlation | Spearman's Correlation |
| DNAJB11 | 0.86 | 0.87 |
| SRP14 | 0.81 | 0.81 |
| SUGT1 | 0.80 | 0.80 |
| AC106037.2 | 0.80 | 0.83 |
| NME7 | 0.80 | 0.81 |
| MRPL9 | 0.80 | 0.80 |
| THOC4 | 0.79 | 0.82 |
| SFRS9 | 0.79 | 0.84 |
| PSMA4 | 0.79 | 0.79 |
| CXorf26 | 0.79 | 0.84 |
| Top 10 negatively co-expressed genes | ||
| Gene | Pearson's Correlation | Spearman's Correlation |
| AF347015.33 | -0.60 | -0.67 |
| AF347015.2 | -0.58 | -0.69 |
| AF347015.27 | -0.58 | -0.65 |
| AF347015.8 | -0.57 | -0.64 |
| AF347015.15 | -0.57 | -0.66 |
| TINAGL1 | -0.57 | -0.64 |
| AF347015.31 | -0.57 | -0.64 |
| MT-CO2 | -0.56 | -0.63 |
| HLA-F | -0.56 | -0.61 |
| AF347015.9 | -0.55 | -0.67 |
Section V. Pathway annotation
| Pathway name | Pathway size | # SZGR 2.0 genes in pathway | Info |
|---|---|---|---|
| PID NEPHRIN NEPH1 PATHWAY | 31 | 24 | All SZGR 2.0 genes in this pathway |
| BENPORATH SUZ12 TARGETS | 1038 | 678 | All SZGR 2.0 genes in this pathway |
| CUI TCF21 TARGETS 2 DN | 830 | 547 | All SZGR 2.0 genes in this pathway |
| CUI TCF21 TARGETS DN | 31 | 23 | All SZGR 2.0 genes in this pathway |
| XU GH1 AUTOCRINE TARGETS DN | 142 | 94 | All SZGR 2.0 genes in this pathway |
| MIKKELSEN MCV6 HCP WITH H3K27ME3 | 435 | 318 | All SZGR 2.0 genes in this pathway |
| MIKKELSEN MEF HCP WITH H3K27ME3 | 590 | 403 | All SZGR 2.0 genes in this pathway |