Gene Page: CACNB3
Summary ?
| GeneID | 784 |
| Symbol | CACNB3 |
| Synonyms | CAB3|CACNLB3 |
| Description | calcium voltage-gated channel auxiliary subunit beta 3 |
| Reference | MIM:601958|HGNC:HGNC:1403|Ensembl:ENSG00000167535|HPRD:11879|Vega:OTTHUMG00000170398 |
| Gene type | protein-coding |
| Map location | 12q13 |
| Pascal p-value | 0.01 |
| DEG p-value | DEG:Maycox_2009:CC_BA10_fold_change=-1.18:CC_BA10_disease_P=0.0055:HBB_BA9_fold_change=-1.26:HBB_BA9_disease_P=0.0011 |
| Fetal beta | -0.113 |
| DMG | 1 (# studies) |
| eGene | Caudate basal ganglia Cerebellum Nucleus accumbens basal ganglia Putamen basal ganglia |
| Support | CANABINOID DOPAMINE EXCITABILITY METABOTROPIC GLUTAMATE RECEPTOR SEROTONIN G2Cdb.human_BAYES-COLLINS-HUMAN-PSD-FULL G2Cdb.human_BAYES-COLLINS-MOUSE-PSD-CONSENSUS G2Cdb.humanPSD G2Cdb.humanPSP CompositeSet Darnell FMRP targets |
Gene in Data Sources
| Gene set name | Method of gene set | Description | Info |
|---|---|---|---|
| CV:PGCnp | Genome-wide Association Study | GWAS | |
| DEG:Maycox_2009 | Microarray to determine the expression of over 30000 mRNA transcripts in post-mortem tissue | We included 51 genes whose expression changes are common between two schizophrenia cohorts. | |
| DMG:Wockner_2014 | Genome-wide DNA methylation analysis | This dataset includes 4641 differentially methylated probes corresponding to 2929 unique genes between schizophrenia patients (n=24) and controls (n=24). | 1 |
Section I. Genetics and epigenetics annotation
 Differentially methylated gene
| Probe | Chromosome | Position | Nearest gene | P (dis) | Beta (dis) | FDR (dis) | Study |
|---|---|---|---|---|---|---|---|
| cg20438663 | 12 | 49213081 | CACNB3 | 3.065E-4 | 0.363 | 0.04 | DMG:Wockner_2014 |
eQTL annotation
| SNP ID | Chromosome | Position | eGene | Gene Entrez ID | pvalue | qvalue | TSS distance | eQTL type |
|---|---|---|---|---|---|---|---|---|
| rs36000595 | 12 | 49196827 | CACNB3 | ENSG00000167535.3 | 1.08885E-6 | 0.01 | -11388 | gtex_brain_putamen_basal |
| rs55916159 | 12 | 49204644 | CACNB3 | ENSG00000167535.3 | 2.39604E-7 | 0.01 | -3571 | gtex_brain_putamen_basal |
| rs11168749 | 12 | 49205634 | CACNB3 | ENSG00000167535.3 | 2.35737E-7 | 0.01 | -2581 | gtex_brain_putamen_basal |
| rs34014405 | 12 | 49211913 | CACNB3 | ENSG00000167535.3 | 2.21771E-7 | 0.01 | 3698 | gtex_brain_putamen_basal |
| rs12369114 | 12 | 49212806 | CACNB3 | ENSG00000167535.3 | 9.63094E-7 | 0.01 | 4591 | gtex_brain_putamen_basal |
| rs68162448 | 12 | 49212874 | CACNB3 | ENSG00000167535.3 | 2.50102E-7 | 0.01 | 4659 | gtex_brain_putamen_basal |
| rs2453467 | 12 | 49239951 | CACNB3 | ENSG00000167535.3 | 2.20998E-7 | 0.01 | 31736 | gtex_brain_putamen_basal |
Section II. Transcriptome annotation
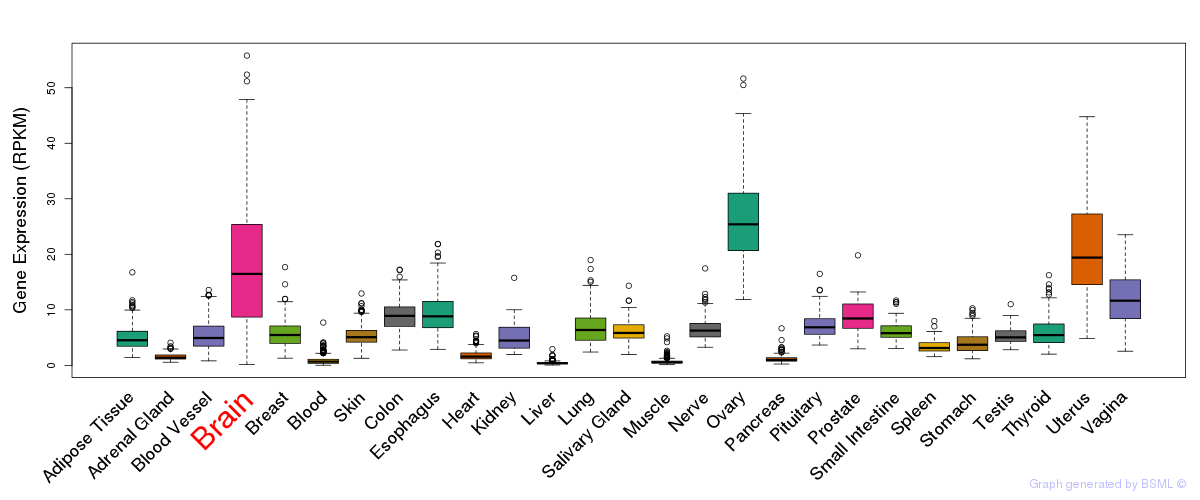
General gene expression (GTEx)
Gene expression during devlopment (BrainCloud)
Footnote:
A total of 269 time points ploted, with n=38 fetal samples (x=1:38). Each triangle represents one time point.
Gene expression of temporal and spatial changes (BrainSpan)
Footnote:
SC: sub-cortical regions; SM: sensory-motor regions; FC: frontal cortex; and TP: temporal-parietal cortex
ST1: fetal (13 - 26 postconception weeks), ST2: early infancy to late childhood (4 months to 11 years), and ST3: adolescence to adulthood (13 - 23 years)
The bar shown representes the lower 25% and upper 25% of the expression distribution.
Top co-expressed genes in brain regions
| Top 10 positively co-expressed genes | ||
| Gene | Pearson's Correlation | Spearman's Correlation |
| ACAA2 | 0.84 | 0.81 |
| S1PR1 | 0.81 | 0.70 |
| PLCD1 | 0.80 | 0.78 |
| MAPKAPK3 | 0.79 | 0.76 |
| HADHB | 0.78 | 0.70 |
| HEPH | 0.77 | 0.67 |
| NDRG2 | 0.76 | 0.64 |
| GLUD1 | 0.76 | 0.64 |
| ALDH4A1 | 0.76 | 0.66 |
| SUCLG2 | 0.75 | 0.65 |
| Top 10 negatively co-expressed genes | ||
| Gene | Pearson's Correlation | Spearman's Correlation |
| DLG3 | -0.50 | -0.44 |
| PPFIA2 | -0.49 | -0.46 |
| ARHGAP20 | -0.48 | -0.45 |
| DCLK1 | -0.48 | -0.44 |
| LINGO2 | -0.47 | -0.45 |
| AL049775.1 | -0.47 | -0.46 |
| YWHAG | -0.47 | -0.41 |
| SYNGAP1 | -0.47 | -0.45 |
| ERC2 | -0.46 | -0.45 |
| INPP4A | -0.46 | -0.41 |
Section V. Pathway annotation
| Pathway name | Pathway size | # SZGR 2.0 genes in pathway | Info |
|---|---|---|---|
| KEGG MAPK SIGNALING PATHWAY | 267 | 205 | All SZGR 2.0 genes in this pathway |
| KEGG CARDIAC MUSCLE CONTRACTION | 80 | 51 | All SZGR 2.0 genes in this pathway |
| KEGG HYPERTROPHIC CARDIOMYOPATHY HCM | 85 | 65 | All SZGR 2.0 genes in this pathway |
| KEGG ARRHYTHMOGENIC RIGHT VENTRICULAR CARDIOMYOPATHY ARVC | 76 | 59 | All SZGR 2.0 genes in this pathway |
| KEGG DILATED CARDIOMYOPATHY | 92 | 68 | All SZGR 2.0 genes in this pathway |
| REACTOME DEVELOPMENTAL BIOLOGY | 396 | 292 | All SZGR 2.0 genes in this pathway |
| REACTOME TRANSMISSION ACROSS CHEMICAL SYNAPSES | 186 | 155 | All SZGR 2.0 genes in this pathway |
| REACTOME NEURONAL SYSTEM | 279 | 221 | All SZGR 2.0 genes in this pathway |
| REACTOME INTEGRATION OF ENERGY METABOLISM | 120 | 84 | All SZGR 2.0 genes in this pathway |
| REACTOME AXON GUIDANCE | 251 | 188 | All SZGR 2.0 genes in this pathway |
| REACTOME NCAM1 INTERACTIONS | 39 | 27 | All SZGR 2.0 genes in this pathway |
| REACTOME REGULATION OF INSULIN SECRETION | 93 | 65 | All SZGR 2.0 genes in this pathway |
| REACTOME NCAM SIGNALING FOR NEURITE OUT GROWTH | 64 | 49 | All SZGR 2.0 genes in this pathway |
| REACTOME INHIBITION OF INSULIN SECRETION BY ADRENALINE NORADRENALINE | 25 | 15 | All SZGR 2.0 genes in this pathway |
| CHARAFE BREAST CANCER LUMINAL VS BASAL UP | 380 | 215 | All SZGR 2.0 genes in this pathway |
| CHARAFE BREAST CANCER LUMINAL VS MESENCHYMAL UP | 450 | 256 | All SZGR 2.0 genes in this pathway |
| ENK UV RESPONSE EPIDERMIS UP | 293 | 179 | All SZGR 2.0 genes in this pathway |
| JOHANSSON GLIOMAGENESIS BY PDGFB DN | 21 | 16 | All SZGR 2.0 genes in this pathway |
| PEREZ TP53 TARGETS | 1174 | 695 | All SZGR 2.0 genes in this pathway |
| SASAI RESISTANCE TO NEOPLASTIC TRANSFROMATION | 50 | 31 | All SZGR 2.0 genes in this pathway |
| PASQUALUCCI LYMPHOMA BY GC STAGE UP | 283 | 177 | All SZGR 2.0 genes in this pathway |
| BENPORATH ES WITH H3K27ME3 | 1118 | 744 | All SZGR 2.0 genes in this pathway |
| CERVERA SDHB TARGETS 1 UP | 118 | 66 | All SZGR 2.0 genes in this pathway |
| BECKER TAMOXIFEN RESISTANCE UP | 50 | 36 | All SZGR 2.0 genes in this pathway |
| ZHAN MULTIPLE MYELOMA LB UP | 48 | 28 | All SZGR 2.0 genes in this pathway |
| LI WILMS TUMOR VS FETAL KIDNEY 1 DN | 163 | 115 | All SZGR 2.0 genes in this pathway |
| HADDAD B LYMPHOCYTE PROGENITOR | 293 | 193 | All SZGR 2.0 genes in this pathway |
| ZAMORA NOS2 TARGETS DN | 96 | 71 | All SZGR 2.0 genes in this pathway |
| DOUGLAS BMI1 TARGETS UP | 566 | 371 | All SZGR 2.0 genes in this pathway |
| FOSTER TOLERANT MACROPHAGE DN | 409 | 268 | All SZGR 2.0 genes in this pathway |
| BOYLAN MULTIPLE MYELOMA C D DN | 252 | 155 | All SZGR 2.0 genes in this pathway |
| YOSHIMURA MAPK8 TARGETS UP | 1305 | 895 | All SZGR 2.0 genes in this pathway |
| AGUIRRE PANCREATIC CANCER COPY NUMBER DN | 238 | 145 | All SZGR 2.0 genes in this pathway |
| HOFFMANN PRE BI TO LARGE PRE BII LYMPHOCYTE UP | 36 | 24 | All SZGR 2.0 genes in this pathway |
| CHEN METABOLIC SYNDROM NETWORK | 1210 | 725 | All SZGR 2.0 genes in this pathway |
| MIKKELSEN MEF ICP WITH H3K4ME3 AND H3K27ME3 | 38 | 34 | All SZGR 2.0 genes in this pathway |
| MIKKELSEN IPS ICP WITH H3K4ME3 AND H327ME3 | 126 | 83 | All SZGR 2.0 genes in this pathway |
| KIM ALL DISORDERS OLIGODENDROCYTE NUMBER CORR UP | 756 | 494 | All SZGR 2.0 genes in this pathway |
| KIM ALL DISORDERS CALB1 CORR UP | 548 | 370 | All SZGR 2.0 genes in this pathway |
| KASLER HDAC7 TARGETS 2 DN | 32 | 23 | All SZGR 2.0 genes in this pathway |
| LEE BMP2 TARGETS UP | 745 | 475 | All SZGR 2.0 genes in this pathway |
| GOBERT OLIGODENDROCYTE DIFFERENTIATION DN | 1080 | 713 | All SZGR 2.0 genes in this pathway |
| LIM MAMMARY LUMINAL MATURE UP | 116 | 65 | All SZGR 2.0 genes in this pathway |