Gene Page: SLMAP
Summary ?
| GeneID | 7871 |
| Symbol | SLMAP |
| Synonyms | SLAP |
| Description | sarcolemma associated protein |
| Reference | MIM:602701|HGNC:HGNC:16643|Ensembl:ENSG00000163681|HPRD:04079|Vega:OTTHUMG00000133764 |
| Gene type | protein-coding |
| Map location | 3p21.2-p14.3 |
| Pascal p-value | 0.314 |
| Fetal beta | 0.581 |
| DMG | 1 (# studies) |
| eGene | Myers' cis & trans |
| Support | G2Cdb.humanNRC |
Gene in Data Sources
| Gene set name | Method of gene set | Description | Info |
|---|---|---|---|
| CV:PGCnp | Genome-wide Association Study | GWAS | |
| DMG:Wockner_2014 | Genome-wide DNA methylation analysis | This dataset includes 4641 differentially methylated probes corresponding to 2929 unique genes between schizophrenia patients (n=24) and controls (n=24). | 1 |
Section I. Genetics and epigenetics annotation
 Differentially methylated gene
| Probe | Chromosome | Position | Nearest gene | P (dis) | Beta (dis) | FDR (dis) | Study |
|---|---|---|---|---|---|---|---|
| cg14861221 | 3 | 57743016 | SLMAP | 3.863E-4 | 0.446 | 0.043 | DMG:Wockner_2014 |
eQTL annotation
| SNP ID | Chromosome | Position | eGene | Gene Entrez ID | pvalue | qvalue | TSS distance | eQTL type |
|---|---|---|---|---|---|---|---|---|
| rs695809 | chr22 | 26278127 | SLMAP | 7871 | 0.15 | trans |
Section II. Transcriptome annotation
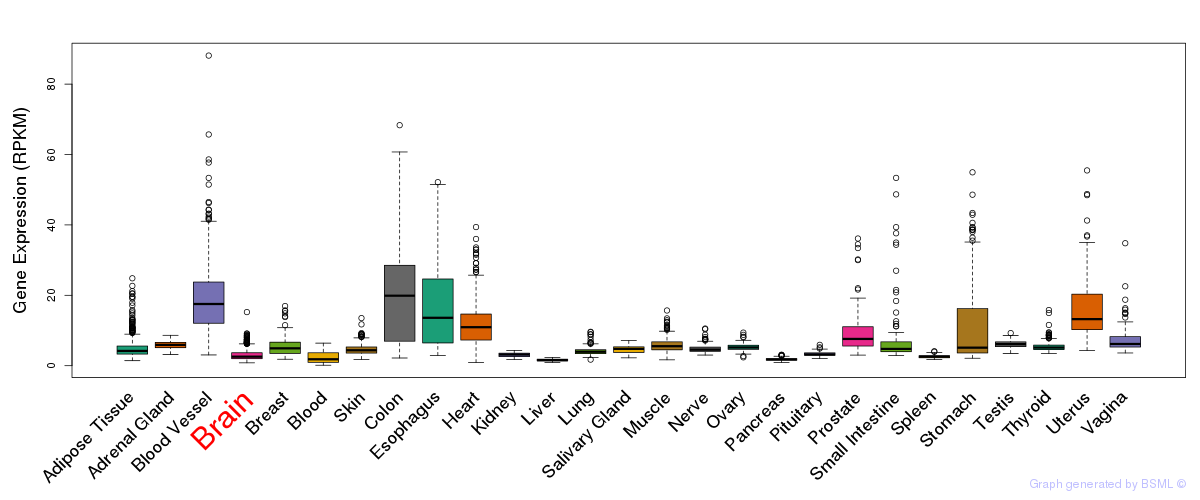
General gene expression (GTEx)
Gene expression during devlopment (BrainCloud)
Footnote:
A total of 269 time points ploted, with n=38 fetal samples (x=1:38). Each triangle represents one time point.
Gene expression of temporal and spatial changes (BrainSpan)
Footnote:
SC: sub-cortical regions; SM: sensory-motor regions; FC: frontal cortex; and TP: temporal-parietal cortex
ST1: fetal (13 - 26 postconception weeks), ST2: early infancy to late childhood (4 months to 11 years), and ST3: adolescence to adulthood (13 - 23 years)
The bar shown representes the lower 25% and upper 25% of the expression distribution.
Top co-expressed genes in brain regions
| Top 10 positively co-expressed genes | ||
| Gene | Pearson's Correlation | Spearman's Correlation |
| C7orf26 | 0.96 | 0.95 |
| DBN1 | 0.95 | 0.96 |
| ZNF48 | 0.95 | 0.95 |
| RBM15B | 0.95 | 0.95 |
| DCAF15 | 0.95 | 0.94 |
| MTA2 | 0.95 | 0.92 |
| TRIM28 | 0.95 | 0.97 |
| CSNK1E | 0.95 | 0.94 |
| AKT1 | 0.95 | 0.94 |
| EIF4A1 | 0.95 | 0.93 |
| Top 10 negatively co-expressed genes | ||
| Gene | Pearson's Correlation | Spearman's Correlation |
| AF347015.27 | -0.77 | -0.91 |
| AF347015.31 | -0.76 | -0.90 |
| MT-CO2 | -0.76 | -0.92 |
| AF347015.33 | -0.76 | -0.91 |
| C5orf53 | -0.76 | -0.79 |
| HLA-F | -0.75 | -0.80 |
| S100B | -0.74 | -0.87 |
| MT-CYB | -0.74 | -0.89 |
| AF347015.8 | -0.74 | -0.91 |
| FXYD1 | -0.73 | -0.87 |
Section V. Pathway annotation
| Pathway name | Pathway size | # SZGR 2.0 genes in pathway | Info |
|---|---|---|---|
| LIU PROSTATE CANCER DN | 481 | 290 | All SZGR 2.0 genes in this pathway |
| RODRIGUES THYROID CARCINOMA POORLY DIFFERENTIATED UP | 633 | 376 | All SZGR 2.0 genes in this pathway |
| HAMAI APOPTOSIS VIA TRAIL UP | 584 | 356 | All SZGR 2.0 genes in this pathway |
| RASHI RESPONSE TO IONIZING RADIATION 5 | 147 | 89 | All SZGR 2.0 genes in this pathway |
| NUYTTEN NIPP1 TARGETS DN | 848 | 527 | All SZGR 2.0 genes in this pathway |
| MONNIER POSTRADIATION TUMOR ESCAPE UP | 393 | 244 | All SZGR 2.0 genes in this pathway |
| ACEVEDO METHYLATED IN LIVER CANCER DN | 940 | 425 | All SZGR 2.0 genes in this pathway |
| CHANDRAN METASTASIS DN | 306 | 191 | All SZGR 2.0 genes in this pathway |
| PLASARI TGFB1 SIGNALING VIA NFIC 10HR UP | 54 | 38 | All SZGR 2.0 genes in this pathway |
| RATTENBACHER BOUND BY CELF1 | 467 | 251 | All SZGR 2.0 genes in this pathway |