Gene Page: CRELD1
Summary ?
| GeneID | 78987 |
| Symbol | CRELD1 |
| Synonyms | AVSD2|CIRRIN |
| Description | cysteine rich with EGF like domains 1 |
| Reference | MIM:607170|HGNC:HGNC:14630|Ensembl:ENSG00000163703|HPRD:06206|Vega:OTTHUMG00000128653 |
| Gene type | protein-coding |
| Map location | 3p25.3 |
| Pascal p-value | 0.492 |
| Sherlock p-value | 0.26 |
| Fetal beta | -1.368 |
| DMG | 1 (# studies) |
| eGene | Myers' cis & trans |
Gene in Data Sources
| Gene set name | Method of gene set | Description | Info |
|---|---|---|---|
| DMG:vanEijk_2014 | Genome-wide DNA methylation analysis | This dataset includes 432 differentially methylated CpG sites corresponding to 391 unique transcripts between schizophrenia patients (n=260) and unaffected controls (n=250). | 1 |
Section I. Genetics and epigenetics annotation
 Differentially methylated gene
| Probe | Chromosome | Position | Nearest gene | P (dis) | Beta (dis) | FDR (dis) | Study |
|---|---|---|---|---|---|---|---|
| cg24596576 | 3 | 10067780 | CRELD1 | 8.25E-5 | 3.871 | DMG:vanEijk_2014 |
eQTL annotation
| SNP ID | Chromosome | Position | eGene | Gene Entrez ID | pvalue | qvalue | TSS distance | eQTL type |
|---|---|---|---|---|---|---|---|---|
| rs3899870 | chr13 | 97205717 | CRELD1 | 78987 | 0.07 | trans |
Section II. Transcriptome annotation
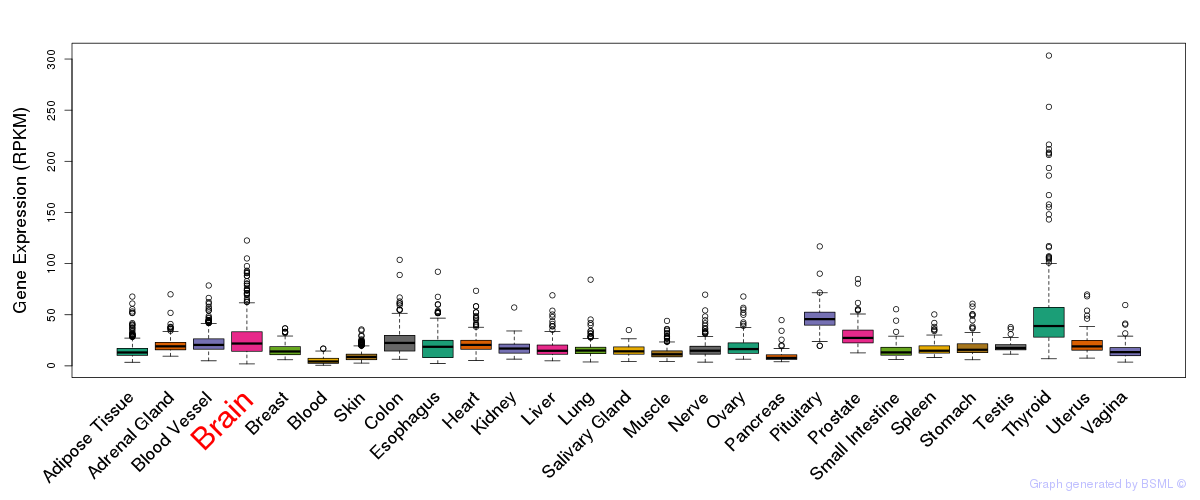
General gene expression (GTEx)
Gene expression during devlopment (BrainCloud)
Footnote:
A total of 269 time points ploted, with n=38 fetal samples (x=1:38). Each triangle represents one time point.
Gene expression of temporal and spatial changes (BrainSpan)
Footnote:
SC: sub-cortical regions; SM: sensory-motor regions; FC: frontal cortex; and TP: temporal-parietal cortex
ST1: fetal (13 - 26 postconception weeks), ST2: early infancy to late childhood (4 months to 11 years), and ST3: adolescence to adulthood (13 - 23 years)
The bar shown representes the lower 25% and upper 25% of the expression distribution.
Top co-expressed genes in brain regions
| Top 10 positively co-expressed genes | ||
| Gene | Pearson's Correlation | Spearman's Correlation |
| IL17RD | 0.81 | 0.81 |
| TBC1D14 | 0.79 | 0.82 |
| TTC28 | 0.79 | 0.81 |
| MTMR3 | 0.78 | 0.79 |
| LRRC55 | 0.78 | 0.81 |
| KLF11 | 0.78 | 0.77 |
| RALGPS1 | 0.78 | 0.79 |
| EFNB2 | 0.78 | 0.77 |
| BCL9 | 0.77 | 0.79 |
| FAM123B | 0.77 | 0.81 |
| Top 10 negatively co-expressed genes | ||
| Gene | Pearson's Correlation | Spearman's Correlation |
| C5orf53 | -0.58 | -0.75 |
| AIFM3 | -0.58 | -0.71 |
| LDHD | -0.56 | -0.66 |
| ALDOC | -0.56 | -0.68 |
| CA4 | -0.55 | -0.75 |
| PTH1R | -0.55 | -0.68 |
| ACOT13 | -0.55 | -0.67 |
| FBXO2 | -0.55 | -0.65 |
| S100B | -0.54 | -0.75 |
| CLU | -0.54 | -0.67 |
Section V. Pathway annotation
| Pathway name | Pathway size | # SZGR 2.0 genes in pathway | Info |
|---|---|---|---|
| DEURIG T CELL PROLYMPHOCYTIC LEUKEMIA UP | 368 | 234 | All SZGR 2.0 genes in this pathway |
| GRAESSMANN APOPTOSIS BY DOXORUBICIN DN | 1781 | 1082 | All SZGR 2.0 genes in this pathway |
| DARWICHE SKIN TUMOR PROMOTER UP | 142 | 96 | All SZGR 2.0 genes in this pathway |
| DARWICHE PAPILLOMA RISK LOW DN | 165 | 107 | All SZGR 2.0 genes in this pathway |
| DARWICHE PAPILLOMA RISK HIGH UP | 147 | 101 | All SZGR 2.0 genes in this pathway |
| DARWICHE SQUAMOUS CELL CARCINOMA UP | 146 | 104 | All SZGR 2.0 genes in this pathway |
| LUI THYROID CANCER CLUSTER 2 | 42 | 31 | All SZGR 2.0 genes in this pathway |
| ONDER CDH1 TARGETS 1 UP | 140 | 85 | All SZGR 2.0 genes in this pathway |
| KRIGE RESPONSE TO TOSEDOSTAT 6HR DN | 911 | 527 | All SZGR 2.0 genes in this pathway |
| KRIGE RESPONSE TO TOSEDOSTAT 24HR DN | 1011 | 592 | All SZGR 2.0 genes in this pathway |
| BRUNEAU SEPTATION VENTRICULAR | 10 | 8 | All SZGR 2.0 genes in this pathway |
| CAIRO HEPATOBLASTOMA CLASSES UP | 605 | 377 | All SZGR 2.0 genes in this pathway |
| GOBERT OLIGODENDROCYTE DIFFERENTIATION DN | 1080 | 713 | All SZGR 2.0 genes in this pathway |
| WAKABAYASHI ADIPOGENESIS PPARG BOUND 8D | 658 | 397 | All SZGR 2.0 genes in this pathway |
| DELACROIX RAR BOUND ES | 462 | 273 | All SZGR 2.0 genes in this pathway |
| NABA ECM GLYCOPROTEINS | 196 | 99 | All SZGR 2.0 genes in this pathway |
| NABA CORE MATRISOME | 275 | 148 | All SZGR 2.0 genes in this pathway |
| NABA MATRISOME | 1028 | 559 | All SZGR 2.0 genes in this pathway |