Gene Page: C17orf53
Summary ?
| GeneID | 78995 |
| Symbol | C17orf53 |
| Synonyms | - |
| Description | chromosome 17 open reading frame 53 |
| Reference | HGNC:HGNC:28460|Ensembl:ENSG00000125319|HPRD:08825|Vega:OTTHUMG00000181808 |
| Gene type | protein-coding |
| Map location | 17q21.31 |
| Pascal p-value | 0.158 |
| Fetal beta | 0.605 |
| DMG | 1 (# studies) |
| eGene | Myers' cis & trans |
Gene in Data Sources
| Gene set name | Method of gene set | Description | Info |
|---|---|---|---|
| CV:PGCnp | Genome-wide Association Study | GWAS | |
| DMG:Jaffe_2016 | Genome-wide DNA methylation analysis | This dataset includes 2,104 probes/CpGs associated with SZ patients (n=108) compared to 136 controls at Bonferroni-adjusted P < 0.05. | 1 |
Section I. Genetics and epigenetics annotation
 Differentially methylated gene
| Probe | Chromosome | Position | Nearest gene | P (dis) | Beta (dis) | FDR (dis) | Study |
|---|---|---|---|---|---|---|---|
| cg11317019 | 17 | 42219250 | C17orf53 | 6.48E-11 | -0.022 | 4.34E-7 | DMG:Jaffe_2016 |
eQTL annotation
| SNP ID | Chromosome | Position | eGene | Gene Entrez ID | pvalue | qvalue | TSS distance | eQTL type |
|---|---|---|---|---|---|---|---|---|
| rs1642598 | chr17 | 42045211 | C17orf53 | 78995 | 0.16 | cis |
Section II. Transcriptome annotation
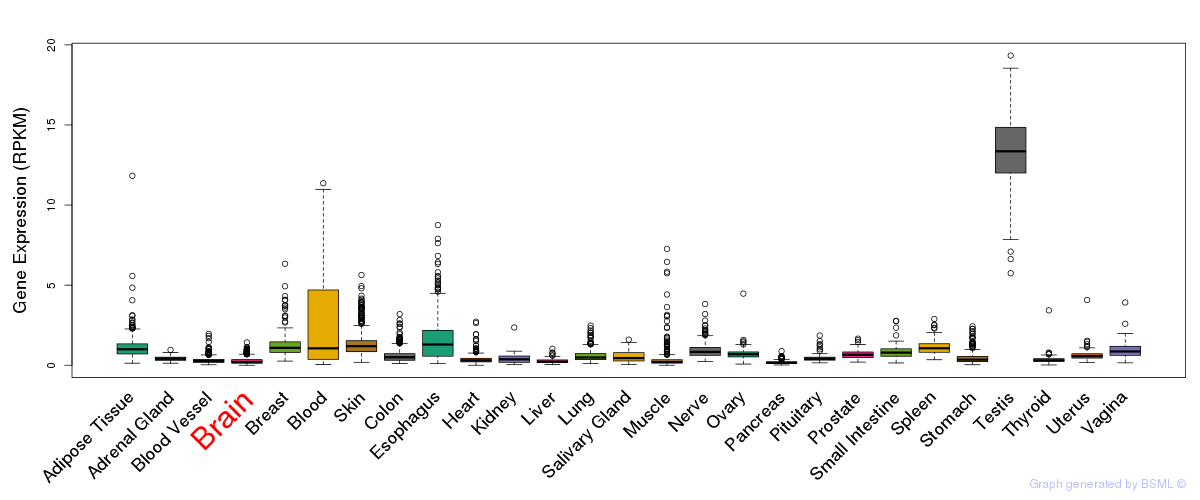
General gene expression (GTEx)
Gene expression during devlopment (BrainCloud)
Footnote:
A total of 269 time points ploted, with n=38 fetal samples (x=1:38). Each triangle represents one time point.
Gene expression of temporal and spatial changes (BrainSpan)
Footnote:
SC: sub-cortical regions; SM: sensory-motor regions; FC: frontal cortex; and TP: temporal-parietal cortex
ST1: fetal (13 - 26 postconception weeks), ST2: early infancy to late childhood (4 months to 11 years), and ST3: adolescence to adulthood (13 - 23 years)
The bar shown representes the lower 25% and upper 25% of the expression distribution.
Top co-expressed genes in brain regions
| Top 10 positively co-expressed genes | ||
| Gene | Pearson's Correlation | Spearman's Correlation |
| NENF | 0.91 | 0.83 |
| HINT2 | 0.87 | 0.77 |
| C2orf7 | 0.87 | 0.79 |
| FTL | 0.87 | 0.78 |
| MSRB2 | 0.86 | 0.81 |
| COX5B | 0.86 | 0.77 |
| MT3 | 0.86 | 0.79 |
| SELM | 0.86 | 0.79 |
| C17orf61 | 0.86 | 0.71 |
| PSMB10 | 0.85 | 0.81 |
| Top 10 negatively co-expressed genes | ||
| Gene | Pearson's Correlation | Spearman's Correlation |
| UPF2 | -0.61 | -0.66 |
| GIGYF2 | -0.61 | -0.67 |
| ZC3H13 | -0.60 | -0.68 |
| RBM25 | -0.60 | -0.76 |
| SLTM | -0.59 | -0.64 |
| CLIP1 | -0.59 | -0.65 |
| ZNF326 | -0.59 | -0.71 |
| USP34 | -0.59 | -0.66 |
| ZNF638 | -0.59 | -0.67 |
| RBM26 | -0.59 | -0.68 |
Section V. Pathway annotation
| Pathway name | Pathway size | # SZGR 2.0 genes in pathway | Info |
|---|---|---|---|
| IWANAGA E2F1 TARGETS INDUCED BY SERUM | 31 | 19 | All SZGR 2.0 genes in this pathway |
| NUYTTEN EZH2 TARGETS DN | 1024 | 594 | All SZGR 2.0 genes in this pathway |
| IVANOVA HEMATOPOIESIS EARLY PROGENITOR | 532 | 309 | All SZGR 2.0 genes in this pathway |
| MARSON BOUND BY E2F4 UNSTIMULATED | 728 | 415 | All SZGR 2.0 genes in this pathway |
| MEISSNER BRAIN HCP WITH H3K4ME2 AND H3K27ME3 | 59 | 35 | All SZGR 2.0 genes in this pathway |
| BHAT ESR1 TARGETS VIA AKT1 UP | 281 | 183 | All SZGR 2.0 genes in this pathway |
| GOBERT OLIGODENDROCYTE DIFFERENTIATION UP | 570 | 339 | All SZGR 2.0 genes in this pathway |
| KATSANOU ELAVL1 TARGETS DN | 148 | 88 | All SZGR 2.0 genes in this pathway |
| DELACROIX RAR BOUND ES | 462 | 273 | All SZGR 2.0 genes in this pathway |
| ZWANG TRANSIENTLY UP BY 1ST EGF PULSE ONLY | 1839 | 928 | All SZGR 2.0 genes in this pathway |