Gene Page: DDA1
Summary ?
| GeneID | 79016 |
| Symbol | DDA1 |
| Synonyms | C19orf58|PCIA1 |
| Description | DET1 and DDB1 associated 1 |
| Reference | HGNC:HGNC:28360|Ensembl:ENSG00000130311|HPRD:15107|Vega:OTTHUMG00000182765 |
| Gene type | protein-coding |
| Map location | 19p13.11 |
| Pascal p-value | 0.877 |
| Sherlock p-value | 0.84 |
| Fetal beta | -0.112 |
| DMG | 1 (# studies) |
Gene in Data Sources
| Gene set name | Method of gene set | Description | Info |
|---|---|---|---|
| CV:PGCnp | Genome-wide Association Study | GWAS | |
| DMG:Wockner_2014 | Genome-wide DNA methylation analysis | This dataset includes 4641 differentially methylated probes corresponding to 2929 unique genes between schizophrenia patients (n=24) and controls (n=24). | 2 |
Section I. Genetics and epigenetics annotation
 Differentially methylated gene
| Probe | Chromosome | Position | Nearest gene | P (dis) | Beta (dis) | FDR (dis) | Study |
|---|---|---|---|---|---|---|---|
| cg24103018 | 19 | 17420930 | DDA1 | 2.26E-5 | -0.247 | 0.017 | DMG:Wockner_2014 |
| cg10664184 | 19 | 17420304 | DDA1 | 1.841E-4 | 0.504 | 0.034 | DMG:Wockner_2014 |
Section II. Transcriptome annotation
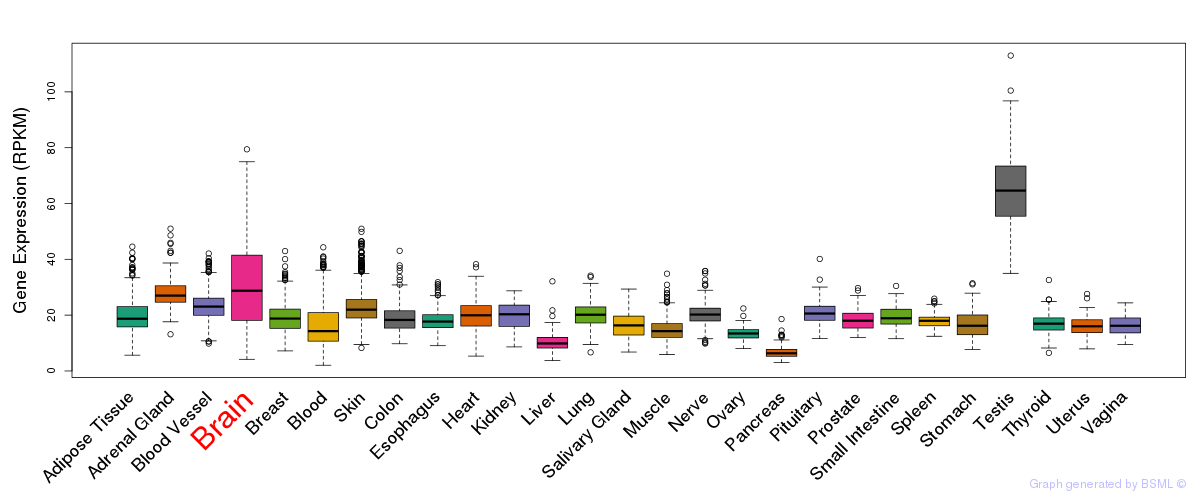
General gene expression (GTEx)
Gene expression during devlopment (BrainCloud)
Footnote:
A total of 269 time points ploted, with n=38 fetal samples (x=1:38). Each triangle represents one time point.
Gene expression of temporal and spatial changes (BrainSpan)
Footnote:
SC: sub-cortical regions; SM: sensory-motor regions; FC: frontal cortex; and TP: temporal-parietal cortex
ST1: fetal (13 - 26 postconception weeks), ST2: early infancy to late childhood (4 months to 11 years), and ST3: adolescence to adulthood (13 - 23 years)
The bar shown representes the lower 25% and upper 25% of the expression distribution.
Top co-expressed genes in brain regions
| Top 10 positively co-expressed genes | ||
| Gene | Pearson's Correlation | Spearman's Correlation |
| C2CD3 | 0.86 | 0.89 |
| RNF216 | 0.85 | 0.88 |
| DHX8 | 0.85 | 0.88 |
| NFX1 | 0.84 | 0.88 |
| SEC24C | 0.84 | 0.88 |
| TP53BP1 | 0.84 | 0.86 |
| STAU1 | 0.84 | 0.87 |
| BRAP | 0.84 | 0.87 |
| CRCP | 0.84 | 0.87 |
| SMG6 | 0.84 | 0.87 |
| Top 10 negatively co-expressed genes | ||
| Gene | Pearson's Correlation | Spearman's Correlation |
| AF347015.31 | -0.74 | -0.81 |
| MT-CO2 | -0.73 | -0.80 |
| AF347015.21 | -0.70 | -0.81 |
| IFI27 | -0.69 | -0.78 |
| HIGD1B | -0.69 | -0.78 |
| AF347015.8 | -0.69 | -0.77 |
| AF347015.27 | -0.69 | -0.77 |
| MT-CYB | -0.68 | -0.75 |
| FXYD1 | -0.68 | -0.77 |
| AF347015.33 | -0.67 | -0.73 |
Section V. Pathway annotation
| Pathway name | Pathway size | # SZGR 2.0 genes in pathway | Info |
|---|---|---|---|
| DAVICIONI TARGETS OF PAX FOXO1 FUSIONS UP | 255 | 177 | All SZGR 2.0 genes in this pathway |
| RICKMAN TUMOR DIFFERENTIATED WELL VS POORLY DN | 382 | 224 | All SZGR 2.0 genes in this pathway |
| RICKMAN METASTASIS DN | 261 | 155 | All SZGR 2.0 genes in this pathway |
| BENPORATH NANOG TARGETS | 988 | 594 | All SZGR 2.0 genes in this pathway |
| BENPORATH SOX2 TARGETS | 734 | 436 | All SZGR 2.0 genes in this pathway |
| BYSTRYKH HEMATOPOIESIS STEM CELL AND BRAIN QTL TRANS | 185 | 114 | All SZGR 2.0 genes in this pathway |
| BYSTRYKH HEMATOPOIESIS STEM CELL AND BRAIN QTL CIS | 65 | 38 | All SZGR 2.0 genes in this pathway |
| BYSTRYKH HEMATOPOIESIS STEM CELL QTL TRANS | 882 | 572 | All SZGR 2.0 genes in this pathway |
| MARSON BOUND BY FOXP3 STIMULATED | 1022 | 619 | All SZGR 2.0 genes in this pathway |
| MARSON BOUND BY FOXP3 UNSTIMULATED | 1229 | 713 | All SZGR 2.0 genes in this pathway |
| WEST ADRENOCORTICAL TUMOR UP | 294 | 199 | All SZGR 2.0 genes in this pathway |
| SHEDDEN LUNG CANCER POOR SURVIVAL A6 | 456 | 285 | All SZGR 2.0 genes in this pathway |
| YAO TEMPORAL RESPONSE TO PROGESTERONE CLUSTER 7 | 76 | 46 | All SZGR 2.0 genes in this pathway |
| PILON KLF1 TARGETS DN | 1972 | 1213 | All SZGR 2.0 genes in this pathway |
| PHONG TNF RESPONSE NOT VIA P38 | 337 | 236 | All SZGR 2.0 genes in this pathway |