Gene Page: MBOAT7
Summary ?
| GeneID | 79143 |
| Symbol | MBOAT7 |
| Synonyms | BB1|LENG4|LPIAT|LRC4|MBOA7|OACT7|hMBOA-7 |
| Description | membrane bound O-acyltransferase domain containing 7 |
| Reference | MIM:606048|HGNC:HGNC:15505|Ensembl:ENSG00000125505|HPRD:06925|Vega:OTTHUMG00000066516 |
| Gene type | protein-coding |
| Map location | 19q13.4 |
| Pascal p-value | 0.03 |
| Sherlock p-value | 0.981 |
| DMG | 1 (# studies) |
| eGene | Myers' cis & trans |
Gene in Data Sources
| Gene set name | Method of gene set | Description | Info |
|---|---|---|---|
| CV:PGCnp | Genome-wide Association Study | GWAS | |
| DMG:Jaffe_2016 | Genome-wide DNA methylation analysis | This dataset includes 2,104 probes/CpGs associated with SZ patients (n=108) compared to 136 controls at Bonferroni-adjusted P < 0.05. | 1 |
Section I. Genetics and epigenetics annotation
 Differentially methylated gene
| Probe | Chromosome | Position | Nearest gene | P (dis) | Beta (dis) | FDR (dis) | Study |
|---|---|---|---|---|---|---|---|
| cg16032746 | 19 | 54693808 | MBOAT7 | 5.4E-10 | -0.018 | 8.9E-7 | DMG:Jaffe_2016 |
eQTL annotation
| SNP ID | Chromosome | Position | eGene | Gene Entrez ID | pvalue | qvalue | TSS distance | eQTL type |
|---|---|---|---|---|---|---|---|---|
| rs4655259 | chr1 | 214637099 | MBOAT7 | 79143 | 0.13 | trans | ||
| rs2329342 | chr7 | 50624970 | MBOAT7 | 79143 | 0.15 | trans |
Section II. Transcriptome annotation
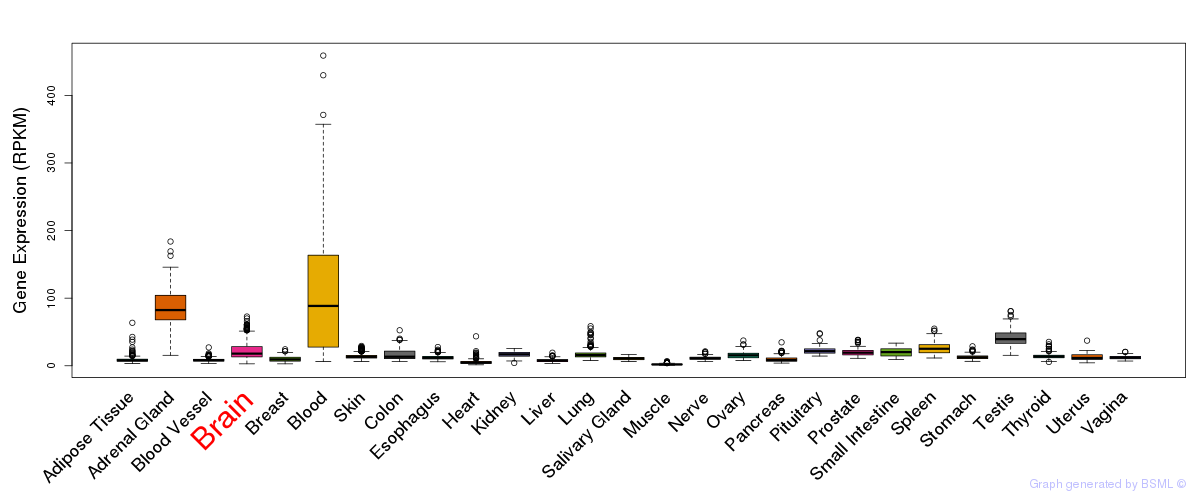
General gene expression (GTEx)
Gene expression of temporal and spatial changes (BrainSpan)
Footnote:
SC: sub-cortical regions; SM: sensory-motor regions; FC: frontal cortex; and TP: temporal-parietal cortex
ST1: fetal (13 - 26 postconception weeks), ST2: early infancy to late childhood (4 months to 11 years), and ST3: adolescence to adulthood (13 - 23 years)
The bar shown representes the lower 25% and upper 25% of the expression distribution.
Top co-expressed genes in brain regions
| Top 10 positively co-expressed genes | ||
| Gene | Pearson's Correlation | Spearman's Correlation |
| HEPACAM | 0.83 | 0.88 |
| TPCN1 | 0.81 | 0.79 |
| GPER | 0.79 | 0.84 |
| NACC2 | 0.78 | 0.83 |
| GPR146 | 0.78 | 0.82 |
| GPR37L1 | 0.78 | 0.86 |
| CHDH | 0.77 | 0.81 |
| CABLES1 | 0.77 | 0.76 |
| HTRA1 | 0.77 | 0.86 |
| ZNF385A | 0.76 | 0.82 |
| Top 10 negatively co-expressed genes | ||
| Gene | Pearson's Correlation | Spearman's Correlation |
| STMN2 | -0.63 | -0.70 |
| MPP3 | -0.62 | -0.66 |
| STMN1 | -0.61 | -0.70 |
| CRMP1 | -0.61 | -0.66 |
| KIAA1949 | -0.61 | -0.59 |
| DUSP12 | -0.61 | -0.68 |
| BZW2 | -0.60 | -0.69 |
| ZNF551 | -0.60 | -0.67 |
| TUBB2B | -0.60 | -0.60 |
| HN1 | -0.60 | -0.68 |
Section V. Pathway annotation
| Pathway name | Pathway size | # SZGR 2.0 genes in pathway | Info |
|---|---|---|---|
| KEGG GLYCEROPHOSPHOLIPID METABOLISM | 77 | 35 | All SZGR 2.0 genes in this pathway |
| REACTOME ACYL CHAIN REMODELLING OF PI | 15 | 8 | All SZGR 2.0 genes in this pathway |
| REACTOME PHOSPHOLIPID METABOLISM | 198 | 112 | All SZGR 2.0 genes in this pathway |
| REACTOME GLYCEROPHOSPHOLIPID BIOSYNTHESIS | 82 | 39 | All SZGR 2.0 genes in this pathway |
| REACTOME METABOLISM OF LIPIDS AND LIPOPROTEINS | 478 | 302 | All SZGR 2.0 genes in this pathway |
| CONCANNON APOPTOSIS BY EPOXOMICIN UP | 239 | 157 | All SZGR 2.0 genes in this pathway |
| APPIERTO RESPONSE TO FENRETINIDE DN | 51 | 35 | All SZGR 2.0 genes in this pathway |
| HERNANDEZ MITOTIC ARREST BY DOCETAXEL 2 UP | 64 | 45 | All SZGR 2.0 genes in this pathway |
| PATIL LIVER CANCER | 747 | 453 | All SZGR 2.0 genes in this pathway |
| DACOSTA UV RESPONSE VIA ERCC3 UP | 309 | 199 | All SZGR 2.0 genes in this pathway |
| MOHANKUMAR TLX1 TARGETS UP | 414 | 287 | All SZGR 2.0 genes in this pathway |
| GRUETZMANN PANCREATIC CANCER UP | 358 | 245 | All SZGR 2.0 genes in this pathway |
| SPIELMAN LYMPHOBLAST EUROPEAN VS ASIAN UP | 479 | 299 | All SZGR 2.0 genes in this pathway |
| FLECHNER PBL KIDNEY TRANSPLANT OK VS DONOR UP | 151 | 100 | All SZGR 2.0 genes in this pathway |
| BECKER TAMOXIFEN RESISTANCE DN | 52 | 37 | All SZGR 2.0 genes in this pathway |
| FERRANDO T ALL WITH MLL ENL FUSION UP | 87 | 67 | All SZGR 2.0 genes in this pathway |
| LEI MYB TARGETS | 318 | 215 | All SZGR 2.0 genes in this pathway |
| PETROVA ENDOTHELIUM LYMPHATIC VS BLOOD DN | 162 | 102 | All SZGR 2.0 genes in this pathway |
| BROWNE HCMV INFECTION 48HR DN | 504 | 323 | All SZGR 2.0 genes in this pathway |
| DOUGLAS BMI1 TARGETS UP | 566 | 371 | All SZGR 2.0 genes in this pathway |
| MASSARWEH TAMOXIFEN RESISTANCE DN | 258 | 160 | All SZGR 2.0 genes in this pathway |
| SARRIO EPITHELIAL MESENCHYMAL TRANSITION UP | 180 | 114 | All SZGR 2.0 genes in this pathway |
| AGUIRRE PANCREATIC CANCER COPY NUMBER UP | 298 | 174 | All SZGR 2.0 genes in this pathway |
| MILI PSEUDOPODIA HAPTOTAXIS DN | 668 | 419 | All SZGR 2.0 genes in this pathway |
| PURBEY TARGETS OF CTBP1 NOT SATB1 UP | 344 | 215 | All SZGR 2.0 genes in this pathway |