Gene Page: GNPTAB
Summary ?
| GeneID | 79158 |
| Symbol | GNPTAB |
| Synonyms | GNPTA|ICD |
| Description | N-acetylglucosamine-1-phosphate transferase alpha and beta subunits |
| Reference | MIM:607840|HGNC:HGNC:29670|Ensembl:ENSG00000111670|HPRD:11350|Vega:OTTHUMG00000170444 |
| Gene type | protein-coding |
| Map location | 12q23.2 |
| Pascal p-value | 0.625 |
| Sherlock p-value | 0.272 |
| Fetal beta | 0.455 |
| DMG | 1 (# studies) |
| eGene | Caudate basal ganglia Cerebellum Myers' cis & trans |
Gene in Data Sources
| Gene set name | Method of gene set | Description | Info |
|---|---|---|---|
| CV:PGCnp | Genome-wide Association Study | GWAS | |
| DMG:Wockner_2014 | Genome-wide DNA methylation analysis | This dataset includes 4641 differentially methylated probes corresponding to 2929 unique genes between schizophrenia patients (n=24) and controls (n=24). | 1 |
Section I. Genetics and epigenetics annotation
 Differentially methylated gene
| Probe | Chromosome | Position | Nearest gene | P (dis) | Beta (dis) | FDR (dis) | Study |
|---|---|---|---|---|---|---|---|
| cg01687189 | 12 | 102225365 | GNPTAB | 5.333E-4 | 0.547 | 0.048 | DMG:Wockner_2014 |
eQTL annotation
| SNP ID | Chromosome | Position | eGene | Gene Entrez ID | pvalue | qvalue | TSS distance | eQTL type |
|---|---|---|---|---|---|---|---|---|
| rs12384693 | 0 | GNPTAB | 79158 | 0.19 | trans |
Section II. Transcriptome annotation
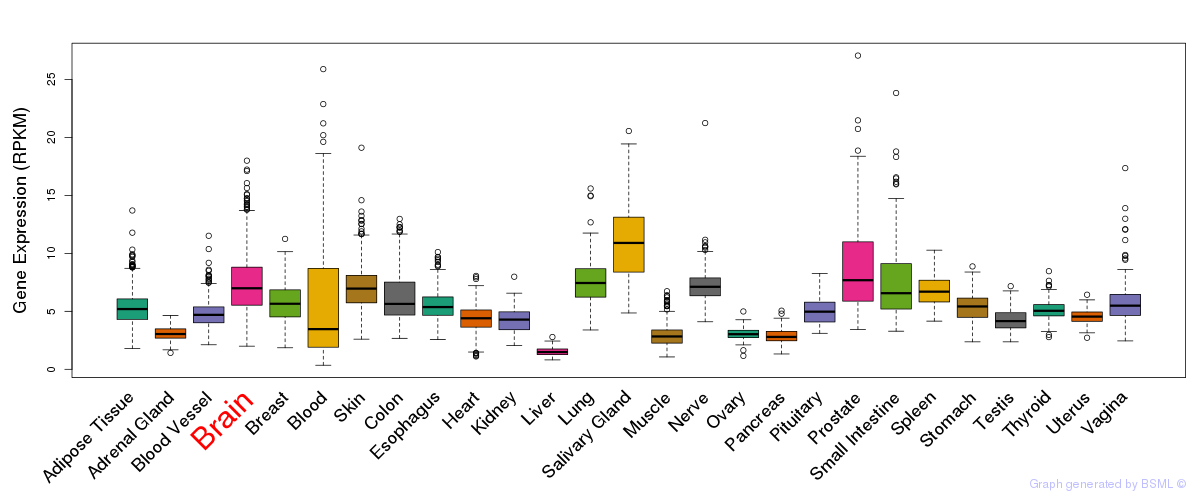
General gene expression (GTEx)
Gene expression during devlopment (BrainCloud)
Footnote:
A total of 269 time points ploted, with n=38 fetal samples (x=1:38). Each triangle represents one time point.
Gene expression of temporal and spatial changes (BrainSpan)
Footnote:
SC: sub-cortical regions; SM: sensory-motor regions; FC: frontal cortex; and TP: temporal-parietal cortex
ST1: fetal (13 - 26 postconception weeks), ST2: early infancy to late childhood (4 months to 11 years), and ST3: adolescence to adulthood (13 - 23 years)
The bar shown representes the lower 25% and upper 25% of the expression distribution.
Top co-expressed genes in brain regions
| Top 10 positively co-expressed genes | ||
| Gene | Pearson's Correlation | Spearman's Correlation |
| ACCN1 | 0.79 | 0.83 |
| C15orf27 | 0.79 | 0.81 |
| SYT5 | 0.79 | 0.83 |
| NRXN2 | 0.78 | 0.77 |
| CILP2 | 0.78 | 0.80 |
| PAK6 | 0.77 | 0.83 |
| AC024575.2 | 0.77 | 0.79 |
| SYT3 | 0.76 | 0.74 |
| C1orf93 | 0.76 | 0.77 |
| STMN3 | 0.75 | 0.77 |
| Top 10 negatively co-expressed genes | ||
| Gene | Pearson's Correlation | Spearman's Correlation |
| MT-CO2 | -0.49 | -0.48 |
| AF347015.33 | -0.47 | -0.45 |
| AF347015.8 | -0.47 | -0.47 |
| MT-CYB | -0.47 | -0.47 |
| AF347015.26 | -0.46 | -0.47 |
| AF347015.27 | -0.46 | -0.47 |
| AF347015.21 | -0.46 | -0.46 |
| AF347015.31 | -0.46 | -0.45 |
| AF347015.15 | -0.44 | -0.44 |
| NOSTRIN | -0.44 | -0.48 |
Section V. Pathway annotation
| Pathway name | Pathway size | # SZGR 2.0 genes in pathway | Info |
|---|---|---|---|
| KEGG LYSOSOME | 121 | 83 | All SZGR 2.0 genes in this pathway |
| ONKEN UVEAL MELANOMA UP | 783 | 507 | All SZGR 2.0 genes in this pathway |
| IGARASHI ATF4 TARGETS DN | 90 | 65 | All SZGR 2.0 genes in this pathway |
| MULLIGHAN MLL SIGNATURE 2 DN | 281 | 186 | All SZGR 2.0 genes in this pathway |
| SABATES COLORECTAL ADENOMA SIZE DN | 14 | 8 | All SZGR 2.0 genes in this pathway |
| PEREZ TP53 TARGETS | 1174 | 695 | All SZGR 2.0 genes in this pathway |
| XU HGF TARGETS REPRESSED BY AKT1 DN | 95 | 58 | All SZGR 2.0 genes in this pathway |
| BENPORATH ES 1 | 379 | 235 | All SZGR 2.0 genes in this pathway |
| BENPORATH NANOG TARGETS | 988 | 594 | All SZGR 2.0 genes in this pathway |
| BENPORATH OCT4 TARGETS | 290 | 172 | All SZGR 2.0 genes in this pathway |
| BENPORATH SOX2 TARGETS | 734 | 436 | All SZGR 2.0 genes in this pathway |
| BENPORATH NOS TARGETS | 179 | 105 | All SZGR 2.0 genes in this pathway |
| IVANOVA HEMATOPOIESIS EARLY PROGENITOR | 532 | 309 | All SZGR 2.0 genes in this pathway |
| BURTON ADIPOGENESIS 2 | 72 | 52 | All SZGR 2.0 genes in this pathway |
| TSENG IRS1 TARGETS DN | 135 | 88 | All SZGR 2.0 genes in this pathway |
| WIERENGA STAT5A TARGETS UP | 217 | 131 | All SZGR 2.0 genes in this pathway |
| WIERENGA STAT5A TARGETS GROUP2 | 60 | 38 | All SZGR 2.0 genes in this pathway |
| PILON KLF1 TARGETS DN | 1972 | 1213 | All SZGR 2.0 genes in this pathway |
| LEE BMP2 TARGETS DN | 882 | 538 | All SZGR 2.0 genes in this pathway |
| GOBERT OLIGODENDROCYTE DIFFERENTIATION DN | 1080 | 713 | All SZGR 2.0 genes in this pathway |
| VANOEVELEN MYOGENESIS SIN3A TARGETS | 220 | 133 | All SZGR 2.0 genes in this pathway |
| PECE MAMMARY STEM CELL UP | 146 | 75 | All SZGR 2.0 genes in this pathway |