Gene Page: LENG1
Summary ?
| GeneID | 79165 |
| Symbol | LENG1 |
| Synonyms | - |
| Description | leukocyte receptor cluster (LRC) member 1 |
| Reference | HGNC:HGNC:15502|HPRD:13985| |
| Gene type | protein-coding |
| Map location | 19q13.4 |
| Pascal p-value | 0.043 |
| Fetal beta | -0.175 |
| eGene | Myers' cis & trans |
| Support | CompositeSet |
Gene in Data Sources
| Gene set name | Method of gene set | Description | Info |
|---|---|---|---|
| DNM:Fromer_2014 | Whole Exome Sequencing analysis | This study reported a WES study of 623 schizophrenia trios, reporting DNMs using genomic DNA. |
Section I. Genetics and epigenetics annotation
 DNM table
| Gene | Chromosome | Position | Ref | Alt | Transcript | AA change | Mutation type | Sift | CG46 | Trait | Study |
|---|---|---|---|---|---|---|---|---|---|---|---|
| LENG1 | chr19 | 54660649 | C | T | NM_024316 | p.143G>S | missense | Schizophrenia | DNM:Fromer_2014 |
eQTL annotation
| SNP ID | Chromosome | Position | eGene | Gene Entrez ID | pvalue | qvalue | TSS distance | eQTL type |
|---|---|---|---|---|---|---|---|---|
| rs12061856 | chr1 | 150001898 | LENG1 | 79165 | 0.17 | trans | ||
| rs7530922 | chr1 | 150023406 | LENG1 | 79165 | 0.14 | trans | ||
| rs11205331 | chr1 | 150104038 | LENG1 | 79165 | 0.13 | trans | ||
| rs12124898 | chr1 | 150154351 | LENG1 | 79165 | 0.13 | trans | ||
| rs9967281 | chr18 | 8999315 | LENG1 | 79165 | 0.08 | trans |
Section II. Transcriptome annotation
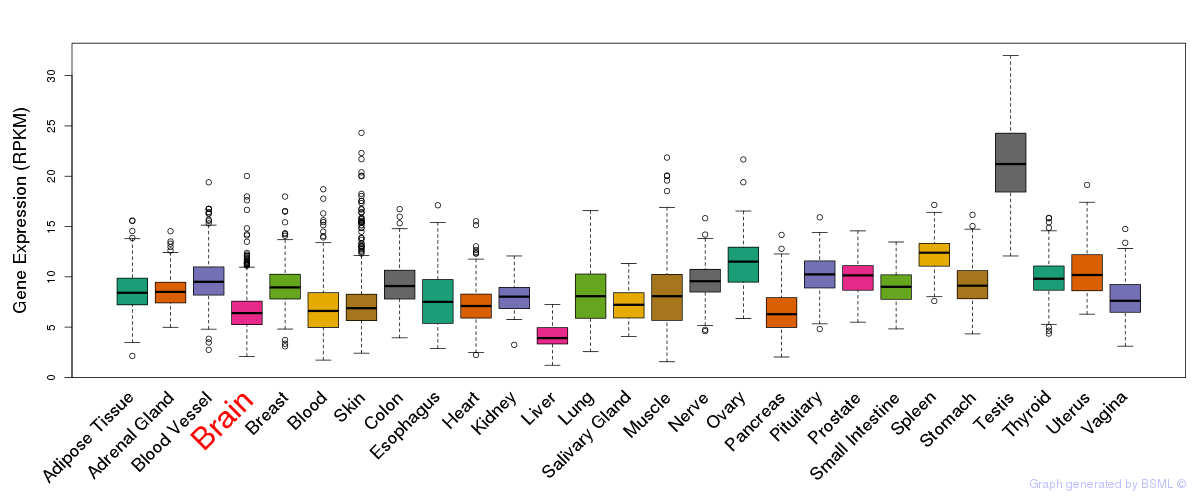
General gene expression (GTEx)
Gene expression during devlopment (BrainCloud)
Footnote:
A total of 269 time points ploted, with n=38 fetal samples (x=1:38). Each triangle represents one time point.
Gene expression of temporal and spatial changes (BrainSpan)
Footnote:
SC: sub-cortical regions; SM: sensory-motor regions; FC: frontal cortex; and TP: temporal-parietal cortex
ST1: fetal (13 - 26 postconception weeks), ST2: early infancy to late childhood (4 months to 11 years), and ST3: adolescence to adulthood (13 - 23 years)
The bar shown representes the lower 25% and upper 25% of the expression distribution.
Top co-expressed genes in brain regions
| Top 10 positively co-expressed genes | ||
| Gene | Pearson's Correlation | Spearman's Correlation |
| SEMA3G | 0.83 | 0.84 |
| FLT1 | 0.83 | 0.84 |
| PTPRB | 0.82 | 0.83 |
| ABCB1 | 0.81 | 0.81 |
| COBLL1 | 0.81 | 0.82 |
| EPAS1 | 0.81 | 0.84 |
| MMRN2 | 0.81 | 0.83 |
| GIMAP8 | 0.81 | 0.81 |
| PTRF | 0.81 | 0.84 |
| A2M | 0.79 | 0.80 |
| Top 10 negatively co-expressed genes | ||
| Gene | Pearson's Correlation | Spearman's Correlation |
| ZNF32 | -0.61 | -0.71 |
| SCNM1 | -0.59 | -0.65 |
| COMMD3 | -0.59 | -0.65 |
| NDUFAF2 | -0.58 | -0.66 |
| POLB | -0.57 | -0.63 |
| OXSM | -0.57 | -0.63 |
| EXOSC8 | -0.57 | -0.65 |
| ALKBH2 | -0.56 | -0.63 |
| C18orf21 | -0.56 | -0.60 |
| OCIAD2 | -0.56 | -0.60 |
Section V. Pathway annotation
| Pathway name | Pathway size | # SZGR 2.0 genes in pathway | Info |
|---|---|---|---|
| GRAESSMANN APOPTOSIS BY DOXORUBICIN UP | 1142 | 669 | All SZGR 2.0 genes in this pathway |
| GRAESSMANN RESPONSE TO MC AND DOXORUBICIN UP | 612 | 367 | All SZGR 2.0 genes in this pathway |
| BHATI G2M ARREST BY 2METHOXYESTRADIOL DN | 127 | 75 | All SZGR 2.0 genes in this pathway |
| WAKABAYASHI ADIPOGENESIS PPARG BOUND 8D | 658 | 397 | All SZGR 2.0 genes in this pathway |