Gene Page: DCAF10
Summary ?
| GeneID | 79269 |
| Symbol | DCAF10 |
| Synonyms | WDR32 |
| Description | DDB1 and CUL4 associated factor 10 |
| Reference | HGNC:HGNC:23686|Ensembl:ENSG00000122741|HPRD:08319| |
| Gene type | protein-coding |
| Map location | 9p13.2 |
| Pascal p-value | 0.061 |
| Sherlock p-value | 0.635 |
| Fetal beta | 0.821 |
| DMG | 1 (# studies) |
Gene in Data Sources
| Gene set name | Method of gene set | Description | Info |
|---|---|---|---|
| CV:PGCnp | Genome-wide Association Study | GWAS | |
| DMG:Jaffe_2016 | Genome-wide DNA methylation analysis | This dataset includes 2,104 probes/CpGs associated with SZ patients (n=108) compared to 136 controls at Bonferroni-adjusted P < 0.05. | 1 |
Section I. Genetics and epigenetics annotation
 Differentially methylated gene
| Probe | Chromosome | Position | Nearest gene | P (dis) | Beta (dis) | FDR (dis) | Study |
|---|---|---|---|---|---|---|---|
| cg04660234 | 9 | 37800484 | DCAF10 | 9.38E-8 | -0.022 | 2.12E-5 | DMG:Jaffe_2016 |
Section II. Transcriptome annotation
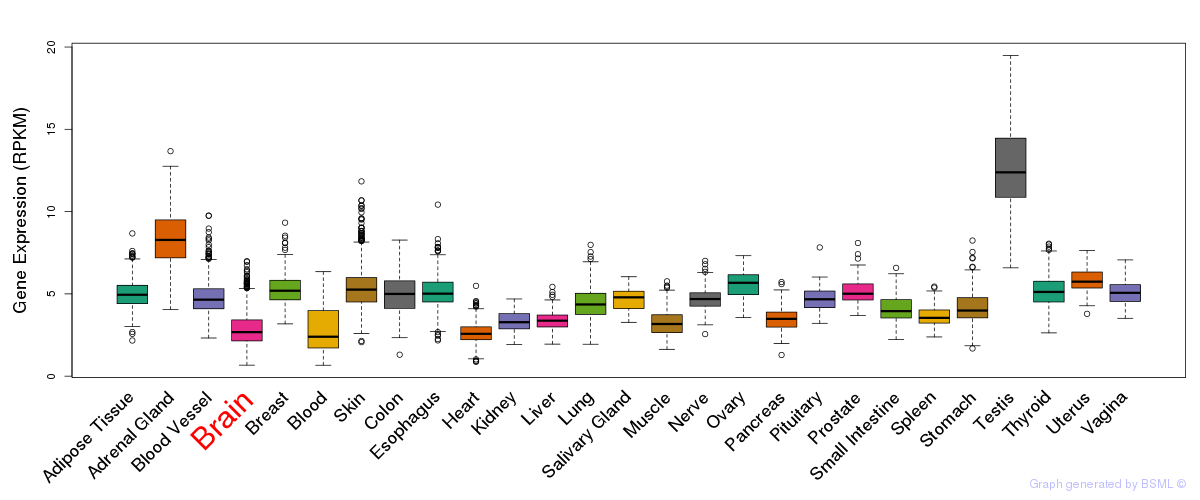
General gene expression (GTEx)
Gene expression during devlopment (BrainCloud)
Footnote:
A total of 269 time points ploted, with n=38 fetal samples (x=1:38). Each triangle represents one time point.
Gene expression of temporal and spatial changes (BrainSpan)
Footnote:
SC: sub-cortical regions; SM: sensory-motor regions; FC: frontal cortex; and TP: temporal-parietal cortex
ST1: fetal (13 - 26 postconception weeks), ST2: early infancy to late childhood (4 months to 11 years), and ST3: adolescence to adulthood (13 - 23 years)
The bar shown representes the lower 25% and upper 25% of the expression distribution.
Top co-expressed genes in brain regions
| Top 10 positively co-expressed genes | ||
| Gene | Pearson's Correlation | Spearman's Correlation |
| POLD1 | 0.83 | 0.73 |
| TCF3 | 0.81 | 0.76 |
| DVL2 | 0.80 | 0.72 |
| MFAP2 | 0.80 | 0.68 |
| HAUS5 | 0.80 | 0.68 |
| TP53 | 0.79 | 0.77 |
| NNAT | 0.79 | 0.68 |
| EFNB1 | 0.79 | 0.71 |
| NME4 | 0.79 | 0.71 |
| CDCA4 | 0.78 | 0.69 |
| Top 10 negatively co-expressed genes | ||
| Gene | Pearson's Correlation | Spearman's Correlation |
| C5orf53 | -0.49 | -0.60 |
| OMG | -0.46 | -0.58 |
| AF347015.27 | -0.46 | -0.59 |
| PTH1R | -0.45 | -0.52 |
| PLA2G4A | -0.45 | -0.56 |
| CCNI2 | -0.45 | -0.54 |
| FBXO2 | -0.45 | -0.51 |
| RGS5 | -0.44 | -0.53 |
| HLA-F | -0.44 | -0.48 |
| AF347015.31 | -0.44 | -0.57 |
Section V. Pathway annotation
| Pathway name | Pathway size | # SZGR 2.0 genes in pathway | Info |
|---|---|---|---|
| NAKAMURA TUMOR ZONE PERIPHERAL VS CENTRAL DN | 634 | 384 | All SZGR 2.0 genes in this pathway |
| FOURNIER ACINAR DEVELOPMENT EARLY UP | 21 | 19 | All SZGR 2.0 genes in this pathway |
| GAZDA DIAMOND BLACKFAN ANEMIA ERYTHROID DN | 493 | 298 | All SZGR 2.0 genes in this pathway |
| OSMAN BLADDER CANCER UP | 404 | 246 | All SZGR 2.0 genes in this pathway |
| FARMER BREAST CANCER APOCRINE VS LUMINAL | 326 | 213 | All SZGR 2.0 genes in this pathway |
| MOHANKUMAR TLX1 TARGETS DN | 193 | 112 | All SZGR 2.0 genes in this pathway |
| IVANOVA HEMATOPOIESIS MATURE CELL | 293 | 160 | All SZGR 2.0 genes in this pathway |
| SMID BREAST CANCER RELAPSE IN BRAIN DN | 85 | 58 | All SZGR 2.0 genes in this pathway |
| SMID BREAST CANCER LUMINAL B UP | 172 | 109 | All SZGR 2.0 genes in this pathway |
| SMID BREAST CANCER BASAL DN | 701 | 446 | All SZGR 2.0 genes in this pathway |
| GABRIELY MIR21 TARGETS | 289 | 187 | All SZGR 2.0 genes in this pathway |