Gene Page: TCTN1
Summary ?
| GeneID | 79600 |
| Symbol | TCTN1 |
| Synonyms | JBTS13|TECT1 |
| Description | tectonic family member 1 |
| Reference | MIM:609863|HGNC:HGNC:26113|Ensembl:ENSG00000204852|HPRD:08636|Vega:OTTHUMG00000150051 |
| Gene type | protein-coding |
| Map location | 12q24.11 |
| Pascal p-value | 5.579E-4 |
| Sherlock p-value | 0.003 |
| Fetal beta | 0.847 |
Gene in Data Sources
| Gene set name | Method of gene set | Description | Info |
|---|---|---|---|
| CV:PGCnp | Genome-wide Association Study | GWAS |
Section I. Genetics and epigenetics annotation
Section II. Transcriptome annotation
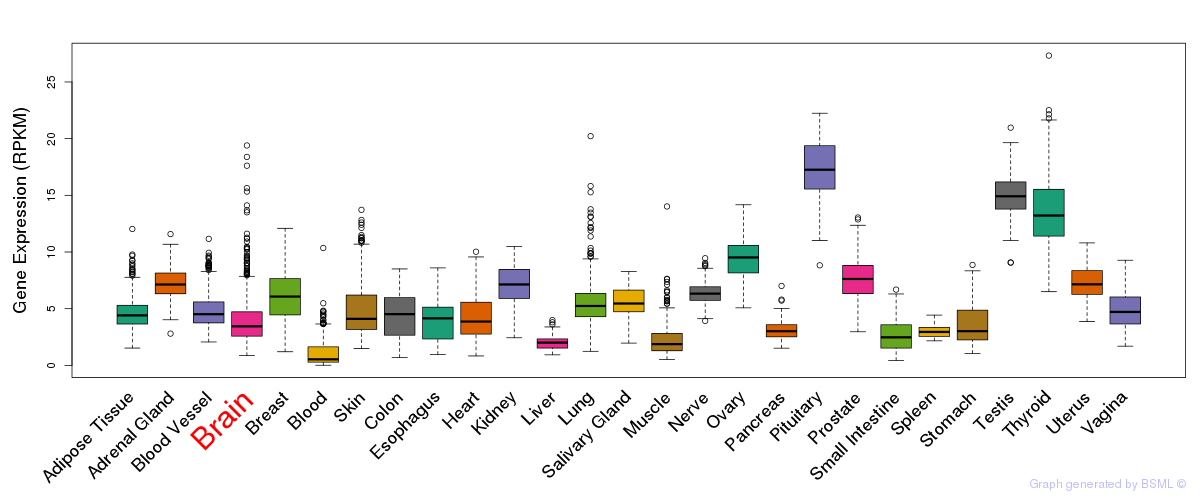
General gene expression (GTEx)
Gene expression during devlopment (BrainCloud)
Footnote:
A total of 269 time points ploted, with n=38 fetal samples (x=1:38). Each triangle represents one time point.
Gene expression of temporal and spatial changes (BrainSpan)
Footnote:
SC: sub-cortical regions; SM: sensory-motor regions; FC: frontal cortex; and TP: temporal-parietal cortex
ST1: fetal (13 - 26 postconception weeks), ST2: early infancy to late childhood (4 months to 11 years), and ST3: adolescence to adulthood (13 - 23 years)
The bar shown representes the lower 25% and upper 25% of the expression distribution.
Top co-expressed genes in brain regions
| Top 10 positively co-expressed genes | ||
| Gene | Pearson's Correlation | Spearman's Correlation |
| GLRA1 | 0.73 | 0.21 |
| DKK4 | 0.65 | 0.26 |
| DIRAS3 | 0.64 | 0.30 |
| PAPPA | 0.63 | 0.33 |
| UBL4B | 0.63 | 0.04 |
| KCNH6 | 0.62 | 0.31 |
| MATN3 | 0.60 | 0.10 |
| CARD11 | 0.59 | 0.14 |
| SCN7A | 0.58 | 0.21 |
| TLL1 | 0.58 | 0.40 |
| Top 10 negatively co-expressed genes | ||
| Gene | Pearson's Correlation | Spearman's Correlation |
| CXCL14 | -0.19 | -0.39 |
| OAF | -0.18 | -0.37 |
| CSAG1 | -0.18 | -0.39 |
| RGS20 | -0.18 | -0.32 |
| CLDN10 | -0.17 | -0.39 |
| AF347015.2 | -0.17 | -0.40 |
| C16orf74 | -0.17 | -0.41 |
| GNG11 | -0.17 | -0.40 |
| AL139819.3 | -0.16 | -0.43 |
| SAT1 | -0.16 | -0.38 |
Section V. Pathway annotation
| Pathway name | Pathway size | # SZGR 2.0 genes in pathway | Info |
|---|---|---|---|
| ZHOU INFLAMMATORY RESPONSE FIMA UP | 544 | 308 | All SZGR 2.0 genes in this pathway |
| DODD NASOPHARYNGEAL CARCINOMA UP | 1821 | 933 | All SZGR 2.0 genes in this pathway |
| RODRIGUES THYROID CARCINOMA POORLY DIFFERENTIATED DN | 805 | 505 | All SZGR 2.0 genes in this pathway |
| RODRIGUES THYROID CARCINOMA ANAPLASTIC DN | 537 | 339 | All SZGR 2.0 genes in this pathway |
| HELLER SILENCED BY METHYLATION UP | 282 | 183 | All SZGR 2.0 genes in this pathway |
| ACEVEDO LIVER TUMOR VS NORMAL ADJACENT TISSUE UP | 863 | 514 | All SZGR 2.0 genes in this pathway |
| DELACROIX RARG BOUND MEF | 367 | 231 | All SZGR 2.0 genes in this pathway |
| DELACROIX RAR BOUND ES | 462 | 273 | All SZGR 2.0 genes in this pathway |