Gene Page: ACSS3
Summary ?
| GeneID | 79611 |
| Symbol | ACSS3 |
| Synonyms | - |
| Description | acyl-CoA synthetase short-chain family member 3 |
| Reference | MIM:614356|HGNC:HGNC:24723|Ensembl:ENSG00000111058|HPRD:13385|Vega:OTTHUMG00000170179 |
| Gene type | protein-coding |
| Map location | 12q21.31 |
| Pascal p-value | 0.226 |
| Fetal beta | -1.525 |
| DMG | 1 (# studies) |
| eGene | Myers' cis & trans |
Gene in Data Sources
| Gene set name | Method of gene set | Description | Info |
|---|---|---|---|
| CV:PGCnp | Genome-wide Association Study | GWAS | |
| DMG:Jaffe_2016 | Genome-wide DNA methylation analysis | This dataset includes 2,104 probes/CpGs associated with SZ patients (n=108) compared to 136 controls at Bonferroni-adjusted P < 0.05. | 1 |
Section I. Genetics and epigenetics annotation
 Differentially methylated gene
| Probe | Chromosome | Position | Nearest gene | P (dis) | Beta (dis) | FDR (dis) | Study |
|---|---|---|---|---|---|---|---|
| cg11659501 | 12 | 81471678 | ACSS3 | 4.39E-9 | -0.015 | 2.6E-6 | DMG:Jaffe_2016 |
eQTL annotation
| SNP ID | Chromosome | Position | eGene | Gene Entrez ID | pvalue | qvalue | TSS distance | eQTL type |
|---|---|---|---|---|---|---|---|---|
| rs7132043 | chr12 | 80968399 | ACSS3 | 79611 | 0.18 | cis |
Section II. Transcriptome annotation
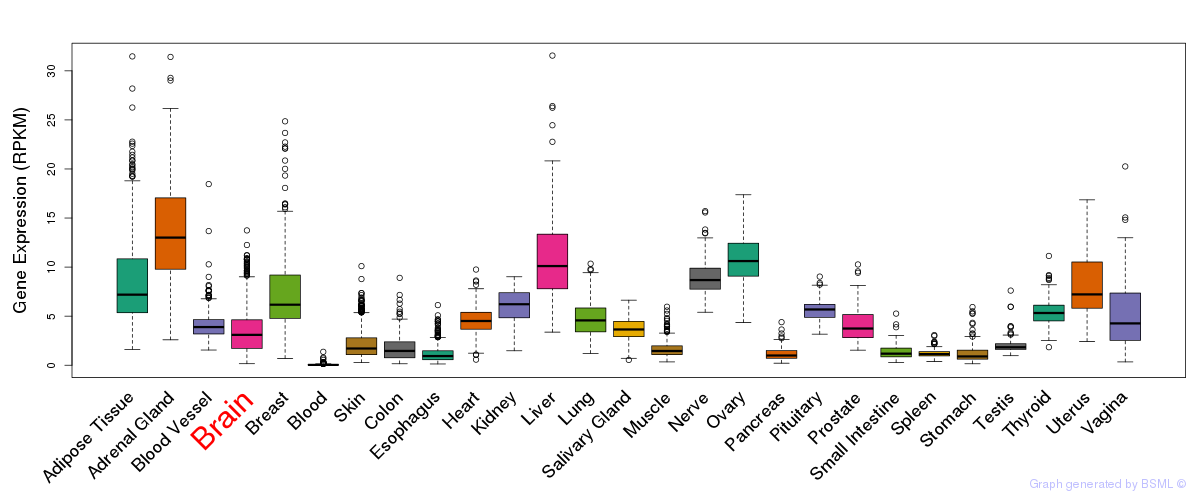
General gene expression (GTEx)
Gene expression during devlopment (BrainCloud)
Footnote:
A total of 269 time points ploted, with n=38 fetal samples (x=1:38). Each triangle represents one time point.
Gene expression of temporal and spatial changes (BrainSpan)
Footnote:
SC: sub-cortical regions; SM: sensory-motor regions; FC: frontal cortex; and TP: temporal-parietal cortex
ST1: fetal (13 - 26 postconception weeks), ST2: early infancy to late childhood (4 months to 11 years), and ST3: adolescence to adulthood (13 - 23 years)
The bar shown representes the lower 25% and upper 25% of the expression distribution.
Top co-expressed genes in brain regions
| Top 10 positively co-expressed genes | ||
| Gene | Pearson's Correlation | Spearman's Correlation |
| TMC6 | 0.93 | 0.88 |
| PLXNB3 | 0.92 | 0.93 |
| SEMA3B | 0.92 | 0.88 |
| ATPGD1 | 0.92 | 0.92 |
| PCTK3 | 0.92 | 0.88 |
| TFEB | 0.91 | 0.88 |
| GSN | 0.90 | 0.88 |
| UAP1L1 | 0.90 | 0.88 |
| LDB3 | 0.89 | 0.89 |
| LDLRAP1 | 0.89 | 0.85 |
| Top 10 negatively co-expressed genes | ||
| Gene | Pearson's Correlation | Spearman's Correlation |
| POLB | -0.63 | -0.75 |
| GSTA4 | -0.62 | -0.70 |
| IFT52 | -0.62 | -0.71 |
| NKIRAS2 | -0.62 | -0.64 |
| ZBED5 | -0.61 | -0.72 |
| RARS2 | -0.61 | -0.69 |
| TRNAU1AP | -0.61 | -0.68 |
| TUBB2B | -0.61 | -0.66 |
| HN1 | -0.60 | -0.69 |
| FRG1 | -0.60 | -0.72 |
Section V. Pathway annotation
| Pathway name | Pathway size | # SZGR 2.0 genes in pathway | Info |
|---|---|---|---|
| KEGG PROPANOATE METABOLISM | 33 | 22 | All SZGR 2.0 genes in this pathway |
| SENGUPTA NASOPHARYNGEAL CARCINOMA WITH LMP1 DN | 175 | 82 | All SZGR 2.0 genes in this pathway |
| WAMUNYOKOLI OVARIAN CANCER LMP DN | 199 | 124 | All SZGR 2.0 genes in this pathway |
| FARMER BREAST CANCER APOCRINE VS BASAL | 330 | 217 | All SZGR 2.0 genes in this pathway |
| DOUGLAS BMI1 TARGETS DN | 314 | 188 | All SZGR 2.0 genes in this pathway |
| CREIGHTON ENDOCRINE THERAPY RESISTANCE 1 | 528 | 324 | All SZGR 2.0 genes in this pathway |
| ACEVEDO METHYLATED IN LIVER CANCER DN | 940 | 425 | All SZGR 2.0 genes in this pathway |
| HUANG DASATINIB RESISTANCE DN | 69 | 44 | All SZGR 2.0 genes in this pathway |
| BOYAULT LIVER CANCER SUBCLASS G6 UP | 65 | 43 | All SZGR 2.0 genes in this pathway |
| CHIANG LIVER CANCER SUBCLASS CTNNB1 UP | 176 | 110 | All SZGR 2.0 genes in this pathway |
| CAIRO HEPATOBLASTOMA UP | 207 | 143 | All SZGR 2.0 genes in this pathway |
| NOUSHMEHR GBM SILENCED BY METHYLATION | 50 | 32 | All SZGR 2.0 genes in this pathway |
| VERHAAK GLIOBLASTOMA CLASSICAL | 162 | 122 | All SZGR 2.0 genes in this pathway |
| PEDERSEN METASTASIS BY ERBB2 ISOFORM 7 | 403 | 240 | All SZGR 2.0 genes in this pathway |