Gene Page: OGFOD2
Summary ?
| GeneID | 79676 |
| Symbol | OGFOD2 |
| Synonyms | - |
| Description | 2-oxoglutarate and iron dependent oxygenase domain containing 2 |
| Reference | HGNC:HGNC:25823|Ensembl:ENSG00000111325|HPRD:07829|Vega:OTTHUMG00000168778 |
| Gene type | protein-coding |
| Map location | 12q24.31 |
| Pascal p-value | 1.27E-10 |
| Sherlock p-value | 0.066 |
| Fetal beta | -1.069 |
| eGene | Hypothalamus Myers' cis & trans Meta |
Gene in Data Sources
| Gene set name | Method of gene set | Description | Info |
|---|---|---|---|
| CV:PGCnp | Genome-wide Association Study | GWAS | |
| LK:YES | Genome-wide Association Study | This data set included 99 genes mapped to the 22 regions. The 24 leading SNPs were also included in CV:Ripke_2013 |
Section I. Genetics and epigenetics annotation
 eQTL annotation
| SNP ID | Chromosome | Position | eGene | Gene Entrez ID | pvalue | qvalue | TSS distance | eQTL type |
|---|---|---|---|---|---|---|---|---|
| rs4275659 | chr12 | 123447927 | OGFOD2 | 79676 | 0.01 | cis | ||
| rs1106240 | chr12 | 123626981 | OGFOD2 | 79676 | 0.03 | cis | ||
| rs1569068 | chr12 | 123632275 | OGFOD2 | 79676 | 0.02 | cis | ||
| rs1727315 | chr12 | 123638929 | OGFOD2 | 79676 | 0.01 | cis | ||
| rs1727313 | chr12 | 123640852 | OGFOD2 | 79676 | 0.03 | cis | ||
| rs1716168 | chr12 | 123651965 | OGFOD2 | 79676 | 0.02 | cis | ||
| rs2695478 | chr12 | 123689520 | OGFOD2 | 79676 | 0 | cis | ||
| rs1609520 | chr12 | 123735936 | OGFOD2 | 79676 | 0.02 | cis | ||
| rs10846489 | chr12 | 123743926 | OGFOD2 | 79676 | 0.03 | cis | ||
| rs2695478 | chr12 | 123689520 | OGFOD2 | 79676 | 0.19 | trans |
Section II. Transcriptome annotation
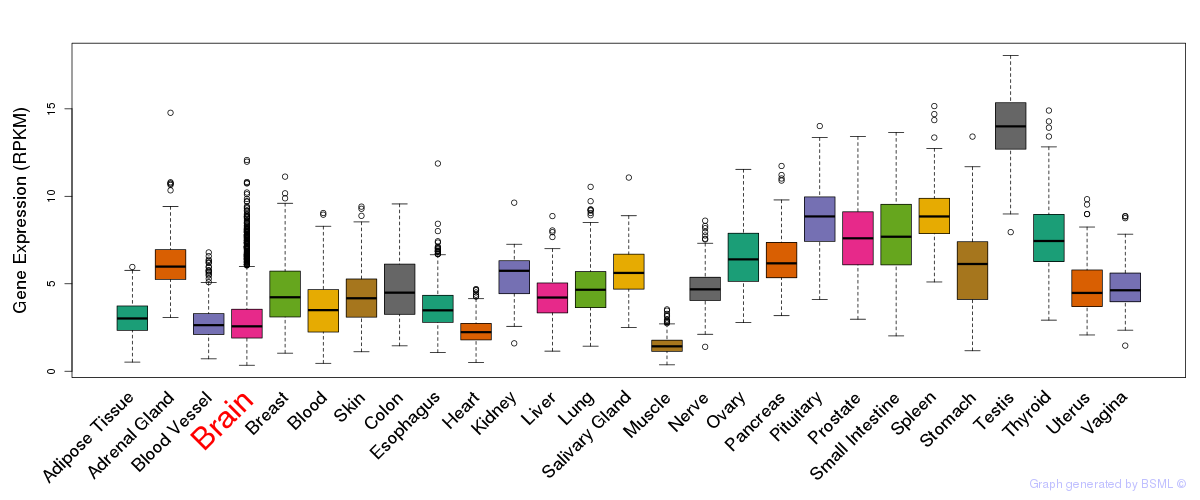
General gene expression (GTEx)
Gene expression during devlopment (BrainCloud)
Footnote:
A total of 269 time points ploted, with n=38 fetal samples (x=1:38). Each triangle represents one time point.
Gene expression of temporal and spatial changes (BrainSpan)
Footnote:
SC: sub-cortical regions; SM: sensory-motor regions; FC: frontal cortex; and TP: temporal-parietal cortex
ST1: fetal (13 - 26 postconception weeks), ST2: early infancy to late childhood (4 months to 11 years), and ST3: adolescence to adulthood (13 - 23 years)
The bar shown representes the lower 25% and upper 25% of the expression distribution.
Top co-expressed genes in brain regions
| Top 10 positively co-expressed genes | ||
| Gene | Pearson's Correlation | Spearman's Correlation |
| TMEM67 | 0.89 | 0.63 |
| EFHC1 | 0.88 | 0.60 |
| C3orf15 | 0.88 | 0.64 |
| CCDC40 | 0.88 | 0.59 |
| LRP2BP | 0.88 | 0.37 |
| CCDC146 | 0.88 | 0.66 |
| DNAH6 | 0.87 | 0.61 |
| TTC25 | 0.86 | 0.58 |
| CCDC81 | 0.85 | 0.51 |
| HYDIN | 0.85 | 0.66 |
| Top 10 negatively co-expressed genes | ||
| Gene | Pearson's Correlation | Spearman's Correlation |
| MT-CO2 | -0.31 | -0.46 |
| AF347015.27 | -0.31 | -0.45 |
| PTGDS | -0.31 | -0.38 |
| AF347015.31 | -0.31 | -0.47 |
| COX4I2 | -0.30 | -0.46 |
| HLA-F | -0.30 | -0.37 |
| AF347015.33 | -0.30 | -0.44 |
| ALDH1A1 | -0.30 | -0.43 |
| MT-CYB | -0.30 | -0.45 |
| CA4 | -0.30 | -0.39 |
Section V. Pathway annotation
| Pathway name | Pathway size | # SZGR 2.0 genes in pathway | Info |
|---|---|---|---|
| MULLIGHAN NPM1 MUTATED SIGNATURE 1 UP | 276 | 165 | All SZGR 2.0 genes in this pathway |
| MULLIGHAN NPM1 SIGNATURE 3 UP | 341 | 197 | All SZGR 2.0 genes in this pathway |
| GRAESSMANN APOPTOSIS BY DOXORUBICIN UP | 1142 | 669 | All SZGR 2.0 genes in this pathway |
| DARWICHE SKIN TUMOR PROMOTER DN | 185 | 115 | All SZGR 2.0 genes in this pathway |
| DARWICHE PAPILLOMA RISK LOW DN | 165 | 107 | All SZGR 2.0 genes in this pathway |
| DARWICHE PAPILLOMA RISK HIGH DN | 180 | 110 | All SZGR 2.0 genes in this pathway |
| DARWICHE SQUAMOUS CELL CARCINOMA DN | 181 | 107 | All SZGR 2.0 genes in this pathway |
| KENNY CTNNB1 TARGETS DN | 52 | 34 | All SZGR 2.0 genes in this pathway |
| KUMAR TARGETS OF MLL AF9 FUSION | 405 | 264 | All SZGR 2.0 genes in this pathway |
| PURBEY TARGETS OF CTBP1 NOT SATB1 DN | 448 | 282 | All SZGR 2.0 genes in this pathway |
| VANOEVELEN MYOGENESIS SIN3A TARGETS | 220 | 133 | All SZGR 2.0 genes in this pathway |
| NABA ECM REGULATORS | 238 | 125 | All SZGR 2.0 genes in this pathway |
| NABA MATRISOME ASSOCIATED | 753 | 411 | All SZGR 2.0 genes in this pathway |
| NABA MATRISOME | 1028 | 559 | All SZGR 2.0 genes in this pathway |