Gene Page: GTDC1
Summary ?
| GeneID | 79712 |
| Symbol | GTDC1 |
| Synonyms | Hmat-Xa|mat-Xa |
| Description | glycosyltransferase like domain containing 1 |
| Reference | MIM:610165|HGNC:HGNC:20887|Ensembl:ENSG00000121964|HPRD:13615|Vega:OTTHUMG00000131835 |
| Gene type | protein-coding |
| Map location | 2q22.3 |
| Pascal p-value | 0.006 |
| Sherlock p-value | 0.63 |
| Fetal beta | -0.013 |
Gene in Data Sources
| Gene set name | Method of gene set | Description | Info |
|---|---|---|---|
| CV:GWASdb | Genome-wide Association Studies | GWASdb records for schizophrenia | |
| CV:PGCnp | Genome-wide Association Study | GWAS | |
| GSMA_I | Genome scan meta-analysis | Psr: 0.023 | |
| GSMA_IIA | Genome scan meta-analysis (All samples) | Psr: 0.02395 |
Section I. Genetics and epigenetics annotation
Section II. Transcriptome annotation
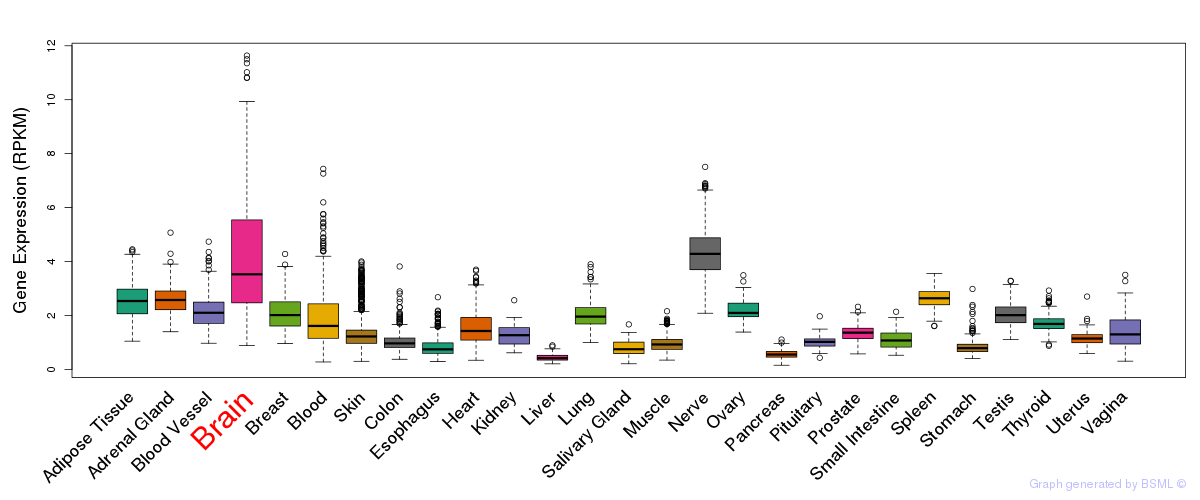
General gene expression (GTEx)

Gene expression during devlopment (BrainCloud)
Footnote:
A total of 269 time points ploted, with n=38 fetal samples (x=1:38). Each triangle represents one time point.
Gene expression of temporal and spatial changes (BrainSpan)
Footnote:
SC: sub-cortical regions; SM: sensory-motor regions; FC: frontal cortex; and TP: temporal-parietal cortex
ST1: fetal (13 - 26 postconception weeks), ST2: early infancy to late childhood (4 months to 11 years), and ST3: adolescence to adulthood (13 - 23 years)
The bar shown representes the lower 25% and upper 25% of the expression distribution.
Top co-expressed genes in brain regions
| Top 10 positively co-expressed genes | ||
| Gene | Pearson's Correlation | Spearman's Correlation |
| GDA | 0.73 | 0.60 |
| MYRIP | 0.71 | 0.60 |
| PTPRR | 0.70 | 0.62 |
| TRHDE | 0.70 | 0.60 |
| RP4-788L13.1 | 0.70 | 0.57 |
| DLGAP2 | 0.70 | 0.60 |
| CLOCK | 0.69 | 0.56 |
| NETO1 | 0.69 | 0.65 |
| GRIN2A | 0.69 | 0.55 |
| GLRA3 | 0.68 | 0.55 |
| Top 10 negatively co-expressed genes | ||
| Gene | Pearson's Correlation | Spearman's Correlation |
| NUDT8 | -0.36 | -0.37 |
| BCL7C | -0.33 | -0.36 |
| EMX2 | -0.32 | -0.41 |
| NT5C | -0.31 | -0.31 |
| ACP6 | -0.31 | -0.30 |
| GRTP1 | -0.31 | -0.31 |
| MUTYH | -0.30 | -0.32 |
| AC132872.1 | -0.30 | -0.33 |
| IMPA2 | -0.30 | -0.35 |
| RDH5 | -0.30 | -0.22 |
Section III. Gene Ontology annotation
| Molecular function | GO term | Evidence | Neuro keywords | PubMed ID |
|---|---|---|---|---|
| GO:0016757 | transferase activity, transferring glycosyl groups | IEA | - | |
| Biological process | GO term | Evidence | Neuro keywords | PubMed ID |
| GO:0009058 | biosynthetic process | IEA | - |
Section V. Pathway annotation
| Pathway name | Pathway size | # SZGR 2.0 genes in pathway | Info |
|---|---|---|---|
| THUM SYSTOLIC HEART FAILURE UP | 423 | 283 | All SZGR 2.0 genes in this pathway |
| GRABARCZYK BCL11B TARGETS DN | 57 | 35 | All SZGR 2.0 genes in this pathway |
| WANG LMO4 TARGETS UP | 372 | 227 | All SZGR 2.0 genes in this pathway |
| MULLIGHAN MLL SIGNATURE 1 DN | 242 | 165 | All SZGR 2.0 genes in this pathway |
| SENESE HDAC3 TARGETS UP | 501 | 327 | All SZGR 2.0 genes in this pathway |
| XU HGF TARGETS REPRESSED BY AKT1 DN | 95 | 58 | All SZGR 2.0 genes in this pathway |
| NUYTTEN NIPP1 TARGETS DN | 848 | 527 | All SZGR 2.0 genes in this pathway |
| NUYTTEN EZH2 TARGETS DN | 1024 | 594 | All SZGR 2.0 genes in this pathway |
| MOREAUX MULTIPLE MYELOMA BY TACI UP | 412 | 249 | All SZGR 2.0 genes in this pathway |
| ZHENG BOUND BY FOXP3 | 491 | 310 | All SZGR 2.0 genes in this pathway |
| KYNG WERNER SYNDROM AND NORMAL AGING UP | 93 | 62 | All SZGR 2.0 genes in this pathway |
| CHANDRAN METASTASIS DN | 306 | 191 | All SZGR 2.0 genes in this pathway |
Section VI. microRNA annotation
| miRNA family | Target position | miRNA ID | miRNA seq | ||
|---|---|---|---|---|---|
| UTR start | UTR end | Match method | |||
| miR-129-5p | 274 | 280 | 1A | hsa-miR-129brain | CUUUUUGCGGUCUGGGCUUGC |
| hsa-miR-129-5p | CUUUUUGCGGUCUGGGCUUGCU | ||||
| miR-132/212 | 267 | 273 | m8 | hsa-miR-212SZ | UAACAGUCUCCAGUCACGGCC |
| hsa-miR-132brain | UAACAGUCUACAGCCAUGGUCG | ||||
| miR-186 | 390 | 396 | m8 | hsa-miR-186 | CAAAGAAUUCUCCUUUUGGGCUU |
| miR-381 | 294 | 300 | 1A | hsa-miR-381 | UAUACAAGGGCAAGCUCUCUGU |
| miR-383 | 75 | 81 | 1A | hsa-miR-383brain | AGAUCAGAAGGUGAUUGUGGCU |
| miR-490 | 470 | 477 | 1A,m8 | hsa-miR-490 | CAACCUGGAGGACUCCAUGCUG |
- SZ: miRNAs which differentially expressed in brain cortex of schizophrenia patients comparing with control samples using microarray. Click here to see the list of SZ related miRNAs.
- Brain: miRNAs which are expressed in brain based on miRNA microarray expression studies. Click here to see the list of brain related miRNAs.