Gene Page: HHIPL2
Summary ?
| GeneID | 79802 |
| Symbol | HHIPL2 |
| Synonyms | KIAA1822L |
| Description | HHIP like 2 |
| Reference | HGNC:HGNC:25842|Ensembl:ENSG00000143512|HPRD:08587|Vega:OTTHUMG00000037545 |
| Gene type | protein-coding |
| Map location | 1q41 |
| Fetal beta | -0.173 |
| DMG | 1 (# studies) |
Gene in Data Sources
| Gene set name | Method of gene set | Description | Info |
|---|---|---|---|
| CV:PGCnp | Genome-wide Association Study | GWAS | |
| DMG:Jaffe_2016 | Genome-wide DNA methylation analysis | This dataset includes 2,104 probes/CpGs associated with SZ patients (n=108) compared to 136 controls at Bonferroni-adjusted P < 0.05. | 2 |
Section I. Genetics and epigenetics annotation
 Differentially methylated gene
| Probe | Chromosome | Position | Nearest gene | P (dis) | Beta (dis) | FDR (dis) | Study |
|---|---|---|---|---|---|---|---|
| cg09974205 | 1 | 222638972 | HHIPL2 | 3.91E-10 | -0.02 | 7.56E-7 | DMG:Jaffe_2016 |
| cg23257028 | 1 | 222717516 | HHIPL2 | 3.86E-9 | 0.024 | 2.42E-6 | DMG:Jaffe_2016 |
Section II. Transcriptome annotation
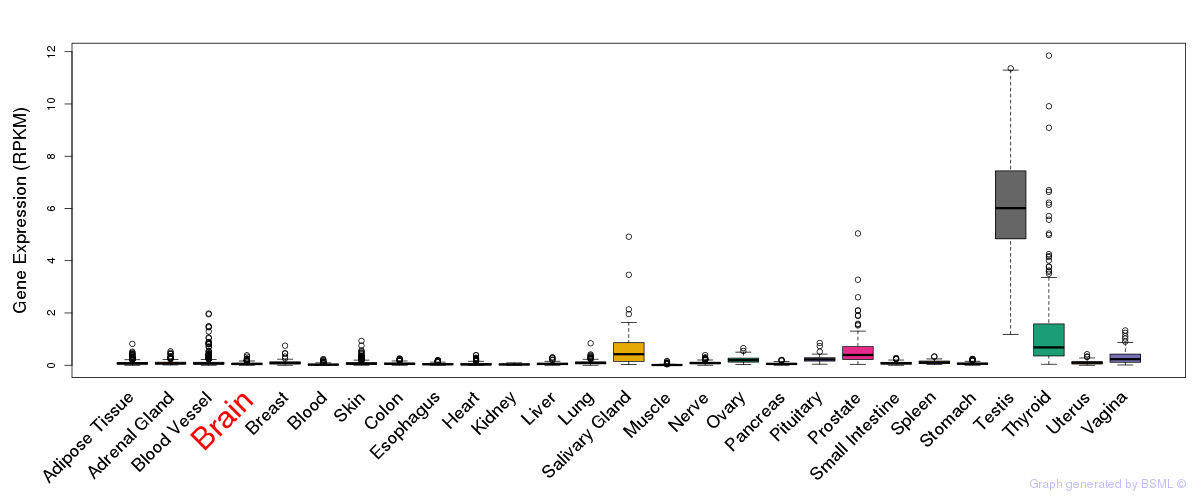
General gene expression (GTEx)
Gene expression during devlopment (BrainCloud)
Footnote:
A total of 269 time points ploted, with n=38 fetal samples (x=1:38). Each triangle represents one time point.
Gene expression of temporal and spatial changes (BrainSpan)
Footnote:
SC: sub-cortical regions; SM: sensory-motor regions; FC: frontal cortex; and TP: temporal-parietal cortex
ST1: fetal (13 - 26 postconception weeks), ST2: early infancy to late childhood (4 months to 11 years), and ST3: adolescence to adulthood (13 - 23 years)
The bar shown representes the lower 25% and upper 25% of the expression distribution.
Top co-expressed genes in brain regions
| Top 10 positively co-expressed genes | ||
| Gene | Pearson's Correlation | Spearman's Correlation |
| ZMYM4 | 0.95 | 0.95 |
| NCBP1 | 0.95 | 0.95 |
| XRCC5 | 0.95 | 0.96 |
| WDR48 | 0.95 | 0.95 |
| SRP72 | 0.95 | 0.95 |
| WDR3 | 0.95 | 0.95 |
| ZNF776 | 0.95 | 0.95 |
| CSDE1 | 0.95 | 0.95 |
| SUPT16H | 0.94 | 0.94 |
| DIS3 | 0.94 | 0.95 |
| Top 10 negatively co-expressed genes | ||
| Gene | Pearson's Correlation | Spearman's Correlation |
| FXYD1 | -0.75 | -0.89 |
| AIFM3 | -0.75 | -0.81 |
| AF347015.31 | -0.74 | -0.86 |
| MT-CO2 | -0.74 | -0.87 |
| HLA-F | -0.74 | -0.80 |
| TSC22D4 | -0.73 | -0.82 |
| IFI27 | -0.73 | -0.88 |
| AF347015.33 | -0.73 | -0.85 |
| AF347015.27 | -0.72 | -0.85 |
| HEPN1 | -0.71 | -0.78 |
Section V. Pathway annotation
| Pathway name | Pathway size | # SZGR 2.0 genes in pathway | Info |
|---|---|---|---|
| NUYTTEN NIPP1 TARGETS UP | 769 | 437 | All SZGR 2.0 genes in this pathway |
| KOYAMA SEMA3B TARGETS DN | 411 | 249 | All SZGR 2.0 genes in this pathway |
| POOLA INVASIVE BREAST CANCER UP | 288 | 168 | All SZGR 2.0 genes in this pathway |