Gene Page: ST7
Summary ?
| GeneID | 7982 |
| Symbol | ST7 |
| Synonyms | ETS7q|FAM4A|FAM4A1|HELG|RAY1|SEN4|TSG7 |
| Description | suppression of tumorigenicity 7 |
| Reference | MIM:600833|HGNC:HGNC:11351|Ensembl:ENSG00000004866|HPRD:09015|Vega:OTTHUMG00000023888 |
| Gene type | protein-coding |
| Map location | 7q31.2 |
| Pascal p-value | 0.053 |
| Sherlock p-value | 0.916 |
| Fetal beta | 1.051 |
| DMG | 1 (# studies) |
| eGene | Myers' cis & trans |
Gene in Data Sources
| Gene set name | Method of gene set | Description | Info |
|---|---|---|---|
| CV:PGCnp | Genome-wide Association Study | GWAS | |
| DMG:Wockner_2014 | Genome-wide DNA methylation analysis | This dataset includes 4641 differentially methylated probes corresponding to 2929 unique genes between schizophrenia patients (n=24) and controls (n=24). | 1 |
Section I. Genetics and epigenetics annotation
 Differentially methylated gene
| Probe | Chromosome | Position | Nearest gene | P (dis) | Beta (dis) | FDR (dis) | Study |
|---|---|---|---|---|---|---|---|
| cg00963942 | 7 | 116638247 | ST7 | 2.38E-5 | 0.252 | 0.017 | DMG:Wockner_2014 |
eQTL annotation
| SNP ID | Chromosome | Position | eGene | Gene Entrez ID | pvalue | qvalue | TSS distance | eQTL type |
|---|---|---|---|---|---|---|---|---|
| rs16829545 | chr2 | 151977407 | ST7 | 7982 | 0.02 | trans | ||
| rs7787830 | chr7 | 98797019 | ST7 | 7982 | 0.06 | trans | ||
| rs16955618 | chr15 | 29937543 | ST7 | 7982 | 0.01 | trans |
Section II. Transcriptome annotation
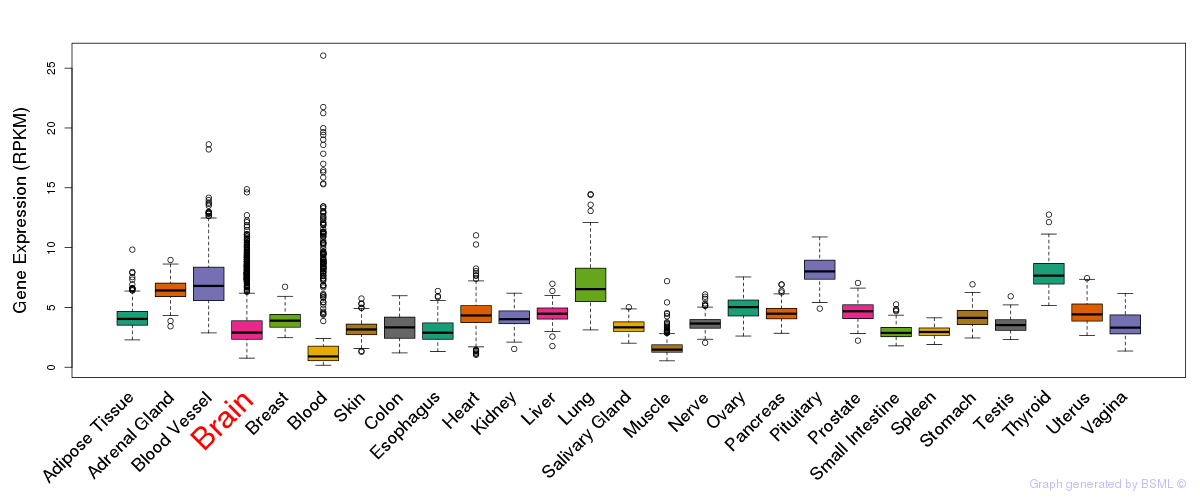
General gene expression (GTEx)
Gene expression during devlopment (BrainCloud)
Footnote:
A total of 269 time points ploted, with n=38 fetal samples (x=1:38). Each triangle represents one time point.
Gene expression of temporal and spatial changes (BrainSpan)
Footnote:
SC: sub-cortical regions; SM: sensory-motor regions; FC: frontal cortex; and TP: temporal-parietal cortex
ST1: fetal (13 - 26 postconception weeks), ST2: early infancy to late childhood (4 months to 11 years), and ST3: adolescence to adulthood (13 - 23 years)
The bar shown representes the lower 25% and upper 25% of the expression distribution.
Top co-expressed genes in brain regions
| Top 10 positively co-expressed genes | ||
| Gene | Pearson's Correlation | Spearman's Correlation |
| DMXL2 | 0.93 | 0.94 |
| BTRC | 0.93 | 0.94 |
| APPL1 | 0.92 | 0.93 |
| WDR7 | 0.91 | 0.91 |
| OPA1 | 0.91 | 0.90 |
| ATE1 | 0.91 | 0.92 |
| KIAA1128 | 0.91 | 0.92 |
| GARNL1 | 0.90 | 0.91 |
| HIPK3 | 0.90 | 0.91 |
| NF1 | 0.90 | 0.93 |
| Top 10 negatively co-expressed genes | ||
| Gene | Pearson's Correlation | Spearman's Correlation |
| HIGD1B | -0.63 | -0.68 |
| FXYD1 | -0.61 | -0.65 |
| MT-CO2 | -0.60 | -0.65 |
| PLA2G5 | -0.59 | -0.64 |
| CST3 | -0.59 | -0.63 |
| AF347015.21 | -0.59 | -0.63 |
| AF347015.31 | -0.58 | -0.63 |
| C1orf54 | -0.58 | -0.68 |
| TLCD1 | -0.58 | -0.62 |
| GSDMD | -0.58 | -0.60 |
Section V. Pathway annotation
| Pathway name | Pathway size | # SZGR 2.0 genes in pathway | Info |
|---|---|---|---|
| LIU SOX4 TARGETS DN | 309 | 191 | All SZGR 2.0 genes in this pathway |
| FULCHER INFLAMMATORY RESPONSE LECTIN VS LPS UP | 579 | 346 | All SZGR 2.0 genes in this pathway |
| CASORELLI ACUTE PROMYELOCYTIC LEUKEMIA DN | 663 | 425 | All SZGR 2.0 genes in this pathway |
| UDAYAKUMAR MED1 TARGETS DN | 240 | 171 | All SZGR 2.0 genes in this pathway |
| LEE NEURAL CREST STEM CELL UP | 146 | 99 | All SZGR 2.0 genes in this pathway |
| ENK UV RESPONSE KERATINOCYTE UP | 530 | 342 | All SZGR 2.0 genes in this pathway |
| MIDORIKAWA AMPLIFIED IN LIVER CANCER | 55 | 38 | All SZGR 2.0 genes in this pathway |
| NELSON RESPONSE TO ANDROGEN DN | 19 | 14 | All SZGR 2.0 genes in this pathway |
| BYSTRYKH HEMATOPOIESIS STEM CELL QTL TRANS | 882 | 572 | All SZGR 2.0 genes in this pathway |
| BROWN MYELOID CELL DEVELOPMENT DN | 129 | 86 | All SZGR 2.0 genes in this pathway |
| BROWNE HCMV INFECTION 16HR UP | 225 | 139 | All SZGR 2.0 genes in this pathway |
| PAL PRMT5 TARGETS UP | 203 | 135 | All SZGR 2.0 genes in this pathway |
| BROWNE HCMV INFECTION 18HR UP | 178 | 111 | All SZGR 2.0 genes in this pathway |
| BROWNE HCMV INFECTION 24HR UP | 148 | 96 | All SZGR 2.0 genes in this pathway |
| CREIGHTON ENDOCRINE THERAPY RESISTANCE 2 | 473 | 224 | All SZGR 2.0 genes in this pathway |
| YEGNASUBRAMANIAN PROSTATE CANCER | 128 | 60 | All SZGR 2.0 genes in this pathway |
| HELLER HDAC TARGETS DN | 292 | 189 | All SZGR 2.0 genes in this pathway |
| HELLER HDAC TARGETS SILENCED BY METHYLATION DN | 281 | 179 | All SZGR 2.0 genes in this pathway |
| RIZKI TUMOR INVASIVENESS 3D UP | 210 | 124 | All SZGR 2.0 genes in this pathway |
| SWEET LUNG CANCER KRAS UP | 491 | 316 | All SZGR 2.0 genes in this pathway |
| ASGHARZADEH NEUROBLASTOMA POOR SURVIVAL DN | 46 | 30 | All SZGR 2.0 genes in this pathway |
| ZEMBUTSU SENSITIVITY TO METHOTREXATE | 18 | 9 | All SZGR 2.0 genes in this pathway |
| KOINUMA TARGETS OF SMAD2 OR SMAD3 | 824 | 528 | All SZGR 2.0 genes in this pathway |