Gene Page: CCDC134
Summary ?
| GeneID | 79879 |
| Symbol | CCDC134 |
| Synonyms | - |
| Description | coiled-coil domain containing 134 |
| Reference | HGNC:HGNC:26185|Ensembl:ENSG00000100147|HPRD:07988|Vega:OTTHUMG00000151262 |
| Gene type | protein-coding |
| Map location | 22q13.2 |
| Pascal p-value | 0.002 |
| Fetal beta | 0.29 |
| DMG | 1 (# studies) |
| eGene | Hippocampus |
Gene in Data Sources
| Gene set name | Method of gene set | Description | Info |
|---|---|---|---|
| CV:PGCnp | Genome-wide Association Study | GWAS | |
| DMG:Jaffe_2016 | Genome-wide DNA methylation analysis | This dataset includes 2,104 probes/CpGs associated with SZ patients (n=108) compared to 136 controls at Bonferroni-adjusted P < 0.05. | 1 |
| PMID:cooccur | High-throughput literature-search | Systematic search in PubMed for genes co-occurring with SCZ keywords. A total of 3027 genes were included. | |
| Literature | High-throughput literature-search | Co-occurance with Schizophrenia keywords: schizophrenia,schizophrenias | Click to show details |
Section I. Genetics and epigenetics annotation
 Differentially methylated gene
| Probe | Chromosome | Position | Nearest gene | P (dis) | Beta (dis) | FDR (dis) | Study |
|---|---|---|---|---|---|---|---|
| cg18046698 | 22 | 42196727 | CCDC134 | 8.6E-8 | -0.007 | 1.98E-5 | DMG:Jaffe_2016 |
Section II. Transcriptome annotation
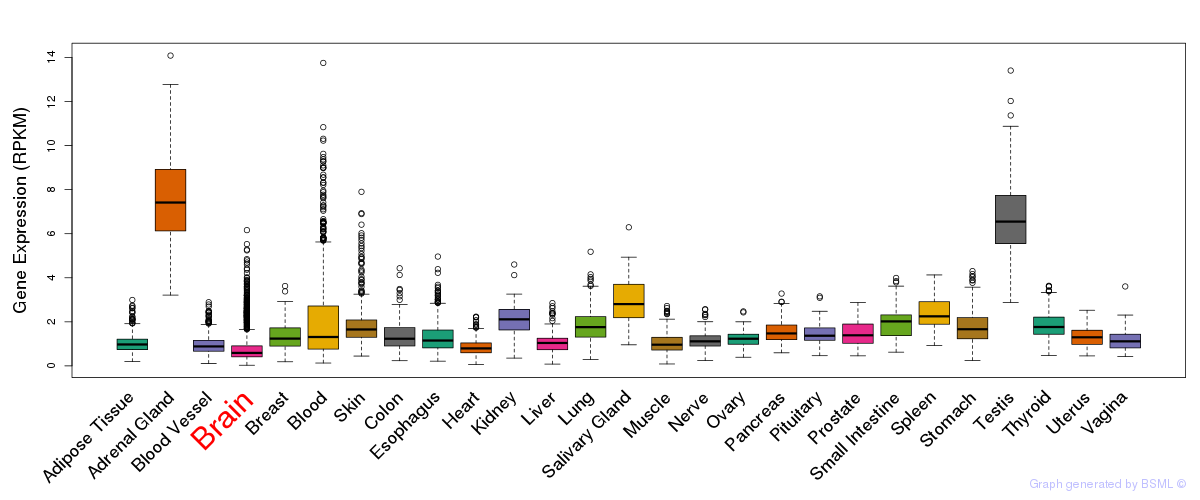
General gene expression (GTEx)
Gene expression during devlopment (BrainCloud)
Footnote:
A total of 269 time points ploted, with n=38 fetal samples (x=1:38). Each triangle represents one time point.
Gene expression of temporal and spatial changes (BrainSpan)
Footnote:
SC: sub-cortical regions; SM: sensory-motor regions; FC: frontal cortex; and TP: temporal-parietal cortex
ST1: fetal (13 - 26 postconception weeks), ST2: early infancy to late childhood (4 months to 11 years), and ST3: adolescence to adulthood (13 - 23 years)
The bar shown representes the lower 25% and upper 25% of the expression distribution.
Top co-expressed genes in brain regions
| Top 10 positively co-expressed genes | ||
| Gene | Pearson's Correlation | Spearman's Correlation |
| SNRPD2 | 0.89 | 0.88 |
| RPP21 | 0.89 | 0.87 |
| NME2 | 0.89 | 0.89 |
| POLR2F | 0.89 | 0.88 |
| EDF1 | 0.88 | 0.87 |
| RPL26L1 | 0.88 | 0.91 |
| TIMM13 | 0.88 | 0.86 |
| NME1-NME2 | 0.88 | 0.89 |
| TSTA3 | 0.87 | 0.88 |
| PSMB7 | 0.87 | 0.88 |
| Top 10 negatively co-expressed genes | ||
| Gene | Pearson's Correlation | Spearman's Correlation |
| AF347015.26 | -0.56 | -0.68 |
| AF347015.2 | -0.54 | -0.65 |
| AF347015.15 | -0.54 | -0.64 |
| AF347015.33 | -0.53 | -0.63 |
| AF347015.27 | -0.53 | -0.63 |
| AF347015.8 | -0.53 | -0.61 |
| MT-CYB | -0.52 | -0.62 |
| MT-CO2 | -0.52 | -0.58 |
| ABCB1 | -0.51 | -0.57 |
| SLC6A12 | -0.51 | -0.60 |
Section V. Pathway annotation
| Pathway name | Pathway size | # SZGR 2.0 genes in pathway | Info |
|---|---|---|---|
| KUNINGER IGF1 VS PDGFB TARGETS UP | 82 | 51 | All SZGR 2.0 genes in this pathway |
| IWANAGA CARCINOGENESIS BY KRAS PTEN DN | 353 | 226 | All SZGR 2.0 genes in this pathway |
| MILI PSEUDOPODIA HAPTOTAXIS DN | 668 | 419 | All SZGR 2.0 genes in this pathway |
| BRUINS UVC RESPONSE VIA TP53 GROUP A | 898 | 516 | All SZGR 2.0 genes in this pathway |
| WAKABAYASHI ADIPOGENESIS PPARG RXRA BOUND 8D | 882 | 506 | All SZGR 2.0 genes in this pathway |