Gene Page: TNKS2
Summary ?
| GeneID | 80351 |
| Symbol | TNKS2 |
| Synonyms | ARTD6|PARP-5b|PARP-5c|PARP5B|PARP5C|TANK2|TNKL|pART6 |
| Description | tankyrase 2 |
| Reference | MIM:607128|HGNC:HGNC:15677|Ensembl:ENSG00000107854|HPRD:06182|Vega:OTTHUMG00000018747 |
| Gene type | protein-coding |
| Map location | 10q23.3 |
| Pascal p-value | 0.061 |
| Fetal beta | 0.427 |
| DMG | 1 (# studies) |
| eGene | Cerebellum Myers' cis & trans Meta |
Gene in Data Sources
| Gene set name | Method of gene set | Description | Info |
|---|---|---|---|
| CV:PGCnp | Genome-wide Association Study | GWAS | |
| DMG:Wockner_2014 | Genome-wide DNA methylation analysis | This dataset includes 4641 differentially methylated probes corresponding to 2929 unique genes between schizophrenia patients (n=24) and controls (n=24). | 2 |
Section I. Genetics and epigenetics annotation
 Differentially methylated gene
| Probe | Chromosome | Position | Nearest gene | P (dis) | Beta (dis) | FDR (dis) | Study |
|---|---|---|---|---|---|---|---|
| cg19912736 | 10 | 93567154 | TNKS2 | 1.638E-4 | 0.424 | 0.033 | DMG:Wockner_2014 |
| cg11963436 | 10 | 93567261 | TNKS2 | 4.123E-4 | 0.663 | 0.044 | DMG:Wockner_2014 |
eQTL annotation
| SNP ID | Chromosome | Position | eGene | Gene Entrez ID | pvalue | qvalue | TSS distance | eQTL type |
|---|---|---|---|---|---|---|---|---|
| rs1570589 | chr9 | 116874354 | TNKS2 | 80351 | 0.19 | trans | ||
| rs10994209 | chr10 | 61877705 | TNKS2 | 80351 | 0.17 | trans |
Section II. Transcriptome annotation
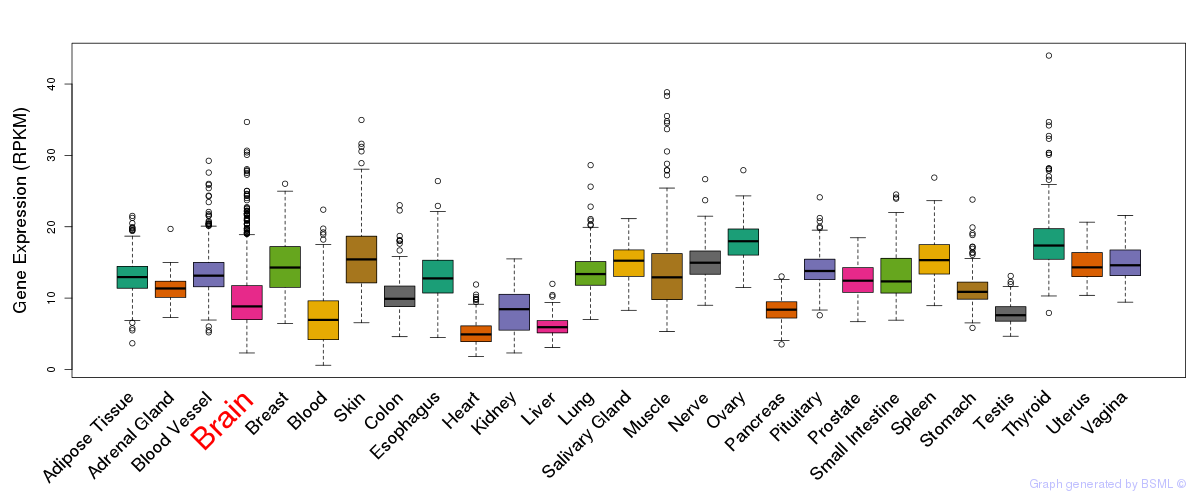
General gene expression (GTEx)
Gene expression during devlopment (BrainCloud)
Footnote:
A total of 269 time points ploted, with n=38 fetal samples (x=1:38). Each triangle represents one time point.
Gene expression of temporal and spatial changes (BrainSpan)
Footnote:
SC: sub-cortical regions; SM: sensory-motor regions; FC: frontal cortex; and TP: temporal-parietal cortex
ST1: fetal (13 - 26 postconception weeks), ST2: early infancy to late childhood (4 months to 11 years), and ST3: adolescence to adulthood (13 - 23 years)
The bar shown representes the lower 25% and upper 25% of the expression distribution.
Top co-expressed genes in brain regions
| Top 10 positively co-expressed genes | ||
| Gene | Pearson's Correlation | Spearman's Correlation |
| TRPV2 | 0.70 | 0.47 |
| CR392039.3 | 0.69 | 0.23 |
| AC130364.2 | 0.69 | 0.46 |
| SIRPB1 | 0.69 | 0.26 |
| HISPPD2A | 0.65 | 0.55 |
| PTPRN | 0.64 | 0.59 |
| SRPR | 0.64 | 0.61 |
| AC134878.1 | 0.63 | 0.13 |
| KCNJ9 | 0.63 | 0.46 |
| CLSTN3 | 0.63 | 0.64 |
| Top 10 negatively co-expressed genes | ||
| Gene | Pearson's Correlation | Spearman's Correlation |
| FAM36A | -0.29 | -0.16 |
| C21orf57 | -0.27 | -0.25 |
| GTF3C6 | -0.25 | -0.21 |
| BCL7C | -0.25 | -0.33 |
| IMPA2 | -0.23 | -0.38 |
| SNHG12 | -0.23 | -0.29 |
| AC090186.1 | -0.23 | -0.18 |
| RPL31 | -0.23 | -0.26 |
| RPL35 | -0.23 | -0.27 |
| RPS20 | -0.22 | -0.28 |
Section V. Pathway annotation
| Pathway name | Pathway size | # SZGR 2.0 genes in pathway | Info |
|---|---|---|---|
| ONKEN UVEAL MELANOMA UP | 783 | 507 | All SZGR 2.0 genes in this pathway |
| HOOI ST7 TARGETS UP | 94 | 57 | All SZGR 2.0 genes in this pathway |
| LIU CMYB TARGETS UP | 165 | 106 | All SZGR 2.0 genes in this pathway |
| LIU VMYB TARGETS UP | 127 | 78 | All SZGR 2.0 genes in this pathway |
| WANG CLIM2 TARGETS DN | 186 | 114 | All SZGR 2.0 genes in this pathway |
| OSMAN BLADDER CANCER UP | 404 | 246 | All SZGR 2.0 genes in this pathway |
| SENESE HDAC3 TARGETS UP | 501 | 327 | All SZGR 2.0 genes in this pathway |
| LASTOWSKA NEUROBLASTOMA COPY NUMBER DN | 800 | 473 | All SZGR 2.0 genes in this pathway |
| YOSHIMURA MAPK8 TARGETS DN | 366 | 257 | All SZGR 2.0 genes in this pathway |
| MILI PSEUDOPODIA HAPTOTAXIS UP | 518 | 299 | All SZGR 2.0 genes in this pathway |
| PILON KLF1 TARGETS UP | 504 | 321 | All SZGR 2.0 genes in this pathway |
| JOHNSTONE PARVB TARGETS 3 UP | 430 | 288 | All SZGR 2.0 genes in this pathway |
| BOUDOUKHA BOUND BY IGF2BP2 | 111 | 59 | All SZGR 2.0 genes in this pathway |