Gene Page: PRR7
Summary ?
| GeneID | 80758 |
| Symbol | PRR7 |
| Synonyms | - |
| Description | proline rich 7 (synaptic) |
| Reference | HGNC:HGNC:28130|Ensembl:ENSG00000131188|HPRD:15186|Vega:OTTHUMG00000130861 |
| Gene type | protein-coding |
| Map location | 5q35.3 |
| Pascal p-value | 0.275 |
| Sherlock p-value | 0.01 |
| Fetal beta | -0.217 |
| DMG | 1 (# studies) |
| eGene | Myers' cis & trans |
| Support | G2Cdb.humanPSD G2Cdb.humanPSP |
Gene in Data Sources
| Gene set name | Method of gene set | Description | Info |
|---|---|---|---|
| DMG:Jaffe_2016 | Genome-wide DNA methylation analysis | This dataset includes 2,104 probes/CpGs associated with SZ patients (n=108) compared to 136 controls at Bonferroni-adjusted P < 0.05. | 1 |
| GSMA_IIA | Genome scan meta-analysis (All samples) | Psr: 0.0276 | |
| GO_Annotation | Mapping neuro-related keywords to Gene Ontology annotations | Hits with neuro-related keywords: 1 |
Section I. Genetics and epigenetics annotation
 Differentially methylated gene
| Probe | Chromosome | Position | Nearest gene | P (dis) | Beta (dis) | FDR (dis) | Study |
|---|---|---|---|---|---|---|---|
| cg10208457 | 5 | 176874324 | PRR7 | 2E-8 | -0.02 | 6.96E-6 | DMG:Jaffe_2016 |
eQTL annotation
| SNP ID | Chromosome | Position | eGene | Gene Entrez ID | pvalue | qvalue | TSS distance | eQTL type |
|---|---|---|---|---|---|---|---|---|
| rs1473812 | chr13 | 33726536 | PRR7 | 80758 | 0.15 | trans | ||
| rs9635390 | chr15 | 90809632 | PRR7 | 80758 | 0.18 | trans |
Section II. Transcriptome annotation
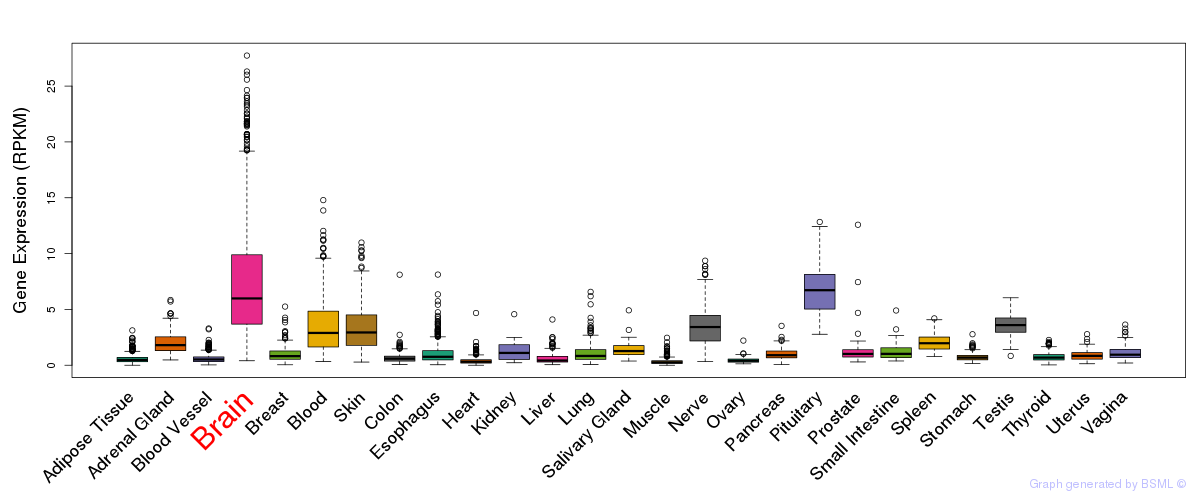
General gene expression (GTEx)
Gene expression during devlopment (BrainCloud)
Footnote:
A total of 269 time points ploted, with n=38 fetal samples (x=1:38). Each triangle represents one time point.
Gene expression of temporal and spatial changes (BrainSpan)
Footnote:
SC: sub-cortical regions; SM: sensory-motor regions; FC: frontal cortex; and TP: temporal-parietal cortex
ST1: fetal (13 - 26 postconception weeks), ST2: early infancy to late childhood (4 months to 11 years), and ST3: adolescence to adulthood (13 - 23 years)
The bar shown representes the lower 25% and upper 25% of the expression distribution.
Top co-expressed genes in brain regions
| Top 10 positively co-expressed genes | ||
| Gene | Pearson's Correlation | Spearman's Correlation |
| INO80D | 0.92 | 0.90 |
| CUGBP2 | 0.92 | 0.92 |
| INSR | 0.92 | 0.92 |
| ABL2 | 0.92 | 0.93 |
| TANC2 | 0.92 | 0.93 |
| ZNF805 | 0.91 | 0.90 |
| KIF1B | 0.91 | 0.94 |
| KIAA1632 | 0.91 | 0.94 |
| GATAD2B | 0.91 | 0.92 |
| LCOR | 0.90 | 0.92 |
| Top 10 negatively co-expressed genes | ||
| Gene | Pearson's Correlation | Spearman's Correlation |
| AF347015.31 | -0.61 | -0.77 |
| SERPINB6 | -0.61 | -0.68 |
| HSD17B14 | -0.60 | -0.71 |
| FXYD1 | -0.60 | -0.75 |
| HIGD1B | -0.60 | -0.78 |
| MT-CO2 | -0.60 | -0.76 |
| IFI27 | -0.59 | -0.75 |
| S100A16 | -0.58 | -0.73 |
| RAMP1 | -0.58 | -0.70 |
| AF347015.27 | -0.58 | -0.72 |
Section III. Gene Ontology annotation
| Cellular component | GO term | Evidence | Neuro keywords | PubMed ID |
|---|---|---|---|---|
| GO:0045211 | postsynaptic membrane | IEA | Synap, Neurotransmitter (GO term level: 5) | - |
| GO:0045202 | synapse | IEA | neuron, Synap, Neurotransmitter, Glial (GO term level: 2) | - |
| GO:0016021 | integral to membrane | IEA | - | |
| GO:0005886 | plasma membrane | IEA | - | |
| GO:0030054 | cell junction | IEA | - |
Section V. Pathway annotation
| Pathway name | Pathway size | # SZGR 2.0 genes in pathway | Info |
|---|---|---|---|
| WANG SMARCE1 TARGETS DN | 371 | 218 | All SZGR 2.0 genes in this pathway |
| KRIGE RESPONSE TO TOSEDOSTAT 6HR DN | 911 | 527 | All SZGR 2.0 genes in this pathway |
| KRIGE RESPONSE TO TOSEDOSTAT 24HR DN | 1011 | 592 | All SZGR 2.0 genes in this pathway |
| BERNARD PPAPDC1B TARGETS DN | 58 | 39 | All SZGR 2.0 genes in this pathway |
| SHEDDEN LUNG CANCER POOR SURVIVAL A6 | 456 | 285 | All SZGR 2.0 genes in this pathway |
| SHAFFER IRF4 TARGETS IN ACTIVATED DENDRITIC CELL | 65 | 49 | All SZGR 2.0 genes in this pathway |
| LI INDUCED T TO NATURAL KILLER UP | 307 | 182 | All SZGR 2.0 genes in this pathway |
| KRIEG HYPOXIA NOT VIA KDM3A | 770 | 480 | All SZGR 2.0 genes in this pathway |
Section VI. microRNA annotation
| miRNA family | Target position | miRNA ID | miRNA seq | ||
|---|---|---|---|---|---|
| UTR start | UTR end | Match method | |||
| miR-194 | 119 | 125 | 1A | hsa-miR-194 | UGUAACAGCAACUCCAUGUGGA |
| miR-329 | 142 | 148 | m8 | hsa-miR-329brain | AACACACCUGGUUAACCUCUUU |
| miR-377 | 144 | 150 | m8 | hsa-miR-377 | AUCACACAAAGGCAACUUUUGU |
| miR-495 | 116 | 123 | 1A,m8 | hsa-miR-495brain | AAACAAACAUGGUGCACUUCUUU |
- SZ: miRNAs which differentially expressed in brain cortex of schizophrenia patients comparing with control samples using microarray. Click here to see the list of SZ related miRNAs.
- Brain: miRNAs which are expressed in brain based on miRNA microarray expression studies. Click here to see the list of brain related miRNAs.