Gene Page: STARD5
Summary ?
| GeneID | 80765 |
| Symbol | STARD5 |
| Synonyms | - |
| Description | StAR related lipid transfer domain containing 5 |
| Reference | MIM:607050|HGNC:HGNC:18065|HPRD:09517| |
| Gene type | protein-coding |
| Map location | 15q26 |
| Pascal p-value | 0.121 |
| Fetal beta | -0.533 |
| DMG | 1 (# studies) |
Gene in Data Sources
| Gene set name | Method of gene set | Description | Info |
|---|---|---|---|
| CV:PGCnp | Genome-wide Association Study | GWAS | |
| DMG:Nishioka_2013 | Genome-wide DNA methylation analysis | The authors investigated the methylation profiles of DNA in peripheral blood cells from 18 patients with first-episode schizophrenia (FESZ) and from 15 normal controls. | 1 |
Section I. Genetics and epigenetics annotation
 Differentially methylated gene
| Probe | Chromosome | Position | Nearest gene | P (dis) | Beta (dis) | FDR (dis) | Study |
|---|---|---|---|---|---|---|---|
| cg27505538 | 15 | 81616786 | STARD5 | -0.024 | 0.54 | DMG:Nishioka_2013 |
Section II. Transcriptome annotation
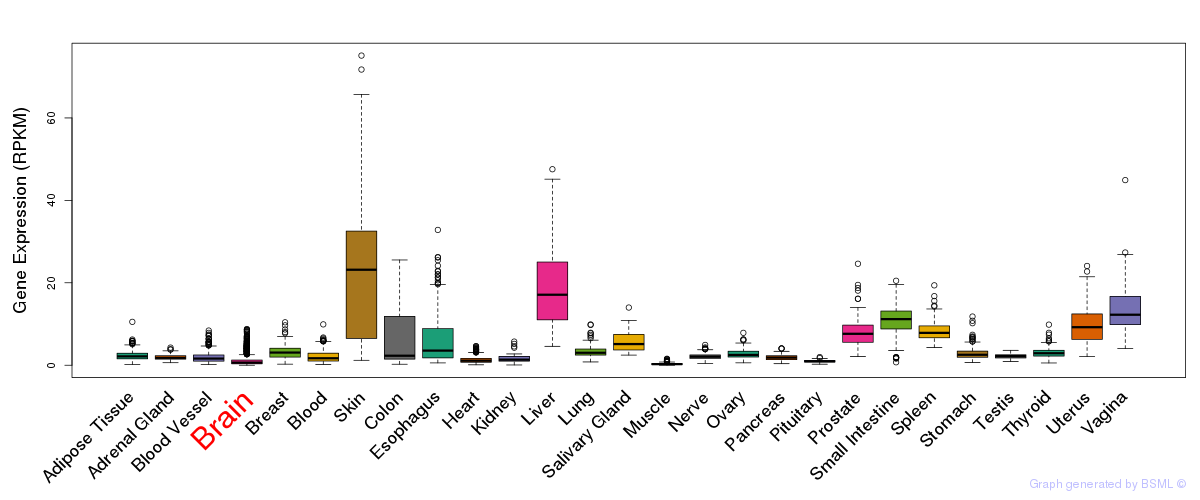
General gene expression (GTEx)
Gene expression during devlopment (BrainCloud)
Footnote:
A total of 269 time points ploted, with n=38 fetal samples (x=1:38). Each triangle represents one time point.
Gene expression of temporal and spatial changes (BrainSpan)
Footnote:
SC: sub-cortical regions; SM: sensory-motor regions; FC: frontal cortex; and TP: temporal-parietal cortex
ST1: fetal (13 - 26 postconception weeks), ST2: early infancy to late childhood (4 months to 11 years), and ST3: adolescence to adulthood (13 - 23 years)
The bar shown representes the lower 25% and upper 25% of the expression distribution.
Top co-expressed genes in brain regions
| Top 10 positively co-expressed genes | ||
| Gene | Pearson's Correlation | Spearman's Correlation |
| LMO3 | 0.78 | 0.78 |
| VSTM2L | 0.74 | 0.78 |
| CYP26A1 | 0.74 | 0.75 |
| FSTL5 | 0.73 | 0.74 |
| ELMOD1 | 0.73 | 0.79 |
| MACROD2 | 0.73 | 0.67 |
| C8orf34 | 0.73 | 0.79 |
| TOX | 0.71 | 0.59 |
| GADL1 | 0.71 | 0.55 |
| KCNK9 | 0.70 | 0.76 |
| Top 10 negatively co-expressed genes | ||
| Gene | Pearson's Correlation | Spearman's Correlation |
| C11orf67 | -0.54 | -0.63 |
| BDH2 | -0.52 | -0.58 |
| ACSF2 | -0.52 | -0.62 |
| AP002478.3 | -0.52 | -0.63 |
| SLC2A4RG | -0.52 | -0.57 |
| FXYD1 | -0.51 | -0.56 |
| HSD17B14 | -0.51 | -0.57 |
| AF347015.26 | -0.51 | -0.55 |
| MT-CO2 | -0.51 | -0.55 |
| FLT3LG | -0.50 | -0.55 |
Section V. Pathway annotation
| Pathway name | Pathway size | # SZGR 2.0 genes in pathway | Info |
|---|---|---|---|
| REACTOME METABOLISM OF STEROID HORMONES AND VITAMINS A AND D | 35 | 23 | All SZGR 2.0 genes in this pathway |
| REACTOME STEROID HORMONES | 29 | 21 | All SZGR 2.0 genes in this pathway |
| REACTOME METABOLISM OF LIPIDS AND LIPOPROTEINS | 478 | 302 | All SZGR 2.0 genes in this pathway |
| LIU CMYB TARGETS UP | 165 | 106 | All SZGR 2.0 genes in this pathway |
| LIU VMYB TARGETS UP | 127 | 78 | All SZGR 2.0 genes in this pathway |
| GRAESSMANN APOPTOSIS BY DOXORUBICIN UP | 1142 | 669 | All SZGR 2.0 genes in this pathway |
| GRAESSMANN RESPONSE TO MC AND DOXORUBICIN UP | 612 | 367 | All SZGR 2.0 genes in this pathway |
| RICKMAN TUMOR DIFFERENTIATED WELL VS POORLY DN | 382 | 224 | All SZGR 2.0 genes in this pathway |
| PASQUALUCCI LYMPHOMA BY GC STAGE UP | 283 | 177 | All SZGR 2.0 genes in this pathway |
| ZHANG RESPONSE TO IKK INHIBITOR AND TNF UP | 223 | 140 | All SZGR 2.0 genes in this pathway |
| BOCHKIS FOXA2 TARGETS | 425 | 261 | All SZGR 2.0 genes in this pathway |
| BOYAULT LIVER CANCER SUBCLASS G23 DN | 10 | 7 | All SZGR 2.0 genes in this pathway |
| CAIRO HEPATOBLASTOMA DN | 267 | 160 | All SZGR 2.0 genes in this pathway |
| ZHAN MULTIPLE MYELOMA CD1 DN | 45 | 30 | All SZGR 2.0 genes in this pathway |
| ZWANG TRANSIENTLY UP BY 1ST EGF PULSE ONLY | 1839 | 928 | All SZGR 2.0 genes in this pathway |