Gene Page: SNX27
Summary ?
| GeneID | 81609 |
| Symbol | SNX27 |
| Synonyms | MRT1|MY014 |
| Description | sorting nexin family member 27 |
| Reference | MIM:611541|HGNC:HGNC:20073|Ensembl:ENSG00000143376|HPRD:11591|Vega:OTTHUMG00000013052 |
| Gene type | protein-coding |
| Map location | 1q21.3 |
| Sherlock p-value | 0.1 |
| Fetal beta | 0.173 |
| DMG | 1 (# studies) |
| eGene | Caudate basal ganglia Cerebellum Cortex |
| Support | G2Cdb.human_BAYES-COLLINS-HUMAN-PSD-CONSENSUS CompositeSet |
Gene in Data Sources
| Gene set name | Method of gene set | Description | Info |
|---|---|---|---|
| CV:PGCnp | Genome-wide Association Study | GWAS | |
| DMG:Wockner_2014 | Genome-wide DNA methylation analysis | This dataset includes 4641 differentially methylated probes corresponding to 2929 unique genes between schizophrenia patients (n=24) and controls (n=24). | 1 |
| GSMA_I | Genome scan meta-analysis | Psr: 0.0235 | |
| GSMA_IIA | Genome scan meta-analysis (All samples) | Psr: 0.00814 |
Section I. Genetics and epigenetics annotation
 Differentially methylated gene
| Probe | Chromosome | Position | Nearest gene | P (dis) | Beta (dis) | FDR (dis) | Study |
|---|---|---|---|---|---|---|---|
| cg16269755 | 1 | 151586058 | SNX27 | 2.885E-4 | 0.337 | 0.039 | DMG:Wockner_2014 |
Section II. Transcriptome annotation
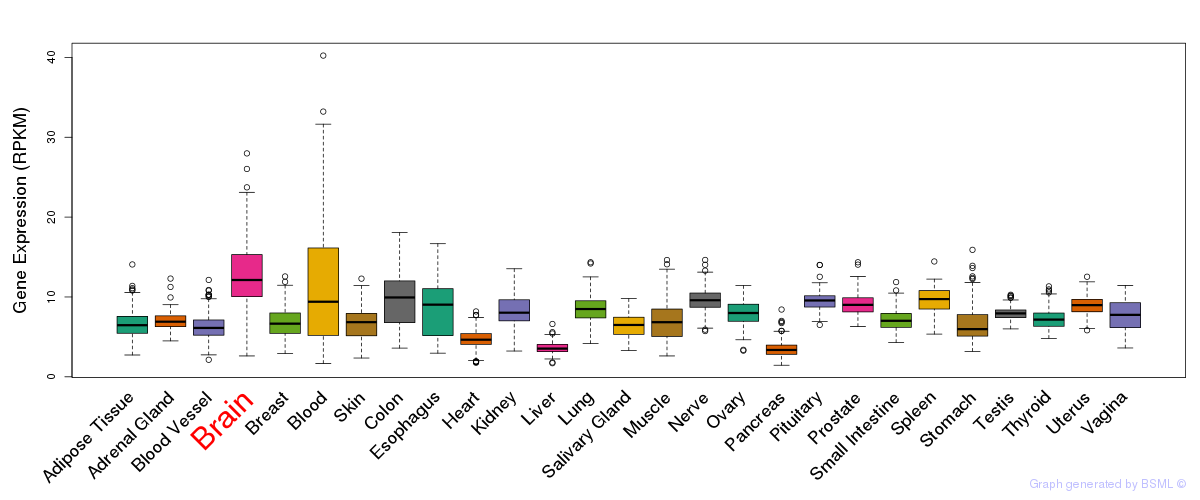
General gene expression (GTEx)
Gene expression during devlopment (BrainCloud)
Footnote:
A total of 269 time points ploted, with n=38 fetal samples (x=1:38). Each triangle represents one time point.
Gene expression of temporal and spatial changes (BrainSpan)
Footnote:
SC: sub-cortical regions; SM: sensory-motor regions; FC: frontal cortex; and TP: temporal-parietal cortex
ST1: fetal (13 - 26 postconception weeks), ST2: early infancy to late childhood (4 months to 11 years), and ST3: adolescence to adulthood (13 - 23 years)
The bar shown representes the lower 25% and upper 25% of the expression distribution.
No co-expressed genes in brain regions
Section III. Gene Ontology annotation
| Molecular function | GO term | Evidence | Neuro keywords | PubMed ID |
|---|---|---|---|---|
| GO:0005515 | protein binding | IEA | - | |
| GO:0035091 | phosphoinositide binding | IEA | - | |
| Biological process | GO term | Evidence | Neuro keywords | PubMed ID |
| GO:0007165 | signal transduction | IEA | - | |
| GO:0015031 | protein transport | IEA | - | |
| Cellular component | GO term | Evidence | Neuro keywords | PubMed ID |
| GO:0005737 | cytoplasm | IEA | - | |
| GO:0005769 | early endosome | IEA | - |
Section V. Pathway annotation
| Pathway name | Pathway size | # SZGR 2.0 genes in pathway | Info |
|---|---|---|---|
| CHARAFE BREAST CANCER LUMINAL VS BASAL UP | 380 | 215 | All SZGR 2.0 genes in this pathway |
| PATIL LIVER CANCER | 747 | 453 | All SZGR 2.0 genes in this pathway |
| MOHANKUMAR TLX1 TARGETS UP | 414 | 287 | All SZGR 2.0 genes in this pathway |
| SHEPARD BMYB MORPHOLINO UP | 205 | 126 | All SZGR 2.0 genes in this pathway |
| BROWNE HCMV INFECTION 18HR UP | 178 | 111 | All SZGR 2.0 genes in this pathway |
| DOUGLAS BMI1 TARGETS UP | 566 | 371 | All SZGR 2.0 genes in this pathway |
| POS RESPONSE TO HISTAMINE UP | 13 | 10 | All SZGR 2.0 genes in this pathway |
| ACEVEDO LIVER TUMOR VS NORMAL ADJACENT TISSUE UP | 863 | 514 | All SZGR 2.0 genes in this pathway |
| ICHIBA GRAFT VERSUS HOST DISEASE D7 DN | 40 | 22 | All SZGR 2.0 genes in this pathway |
| CHEN METABOLIC SYNDROM NETWORK | 1210 | 725 | All SZGR 2.0 genes in this pathway |
| BRUINS UVC RESPONSE LATE | 1137 | 655 | All SZGR 2.0 genes in this pathway |
| TERAO AOX4 TARGETS HG UP | 28 | 20 | All SZGR 2.0 genes in this pathway |
| PEDERSEN METASTASIS BY ERBB2 ISOFORM 7 | 403 | 240 | All SZGR 2.0 genes in this pathway |
Section VI. microRNA annotation
| miRNA family | Target position | miRNA ID | miRNA seq | ||
|---|---|---|---|---|---|
| UTR start | UTR end | Match method | |||
| miR-130/301 | 1166 | 1172 | m8 | hsa-miR-130abrain | CAGUGCAAUGUUAAAAGGGCAU |
| hsa-miR-301 | CAGUGCAAUAGUAUUGUCAAAGC | ||||
| hsa-miR-130bbrain | CAGUGCAAUGAUGAAAGGGCAU | ||||
| hsa-miR-454-3p | UAGUGCAAUAUUGCUUAUAGGGUUU | ||||
| miR-141/200a | 4070 | 4076 | m8 | hsa-miR-141 | UAACACUGUCUGGUAAAGAUGG |
| hsa-miR-200a | UAACACUGUCUGGUAACGAUGU | ||||
| miR-145 | 1141 | 1148 | 1A,m8 | hsa-miR-145 | GUCCAGUUUUCCCAGGAAUCCCUU |
| miR-148/152 | 1167 | 1173 | m8 | hsa-miR-148a | UCAGUGCACUACAGAACUUUGU |
| hsa-miR-152brain | UCAGUGCAUGACAGAACUUGGG | ||||
| hsa-miR-148b | UCAGUGCAUCACAGAACUUUGU | ||||
| miR-183 | 1483 | 1489 | 1A | hsa-miR-183 | UAUGGCACUGGUAGAAUUCACUG |
| miR-186 | 5446 | 5452 | m8 | hsa-miR-186 | CAAAGAAUUCUCCUUUUGGGCUU |
| miR-19 | 1165 | 1171 | m8 | hsa-miR-19a | UGUGCAAAUCUAUGCAAAACUGA |
| hsa-miR-19b | UGUGCAAAUCCAUGCAAAACUGA | ||||
| miR-205 | 1403 | 1410 | 1A,m8 | hsa-miR-205 | UCCUUCAUUCCACCGGAGUCUG |
| miR-217 | 5290 | 5296 | 1A | hsa-miR-217 | UACUGCAUCAGGAACUGAUUGGAU |
| miR-23 | 5325 | 5332 | 1A,m8 | hsa-miR-23abrain | AUCACAUUGCCAGGGAUUUCC |
| hsa-miR-23bbrain | AUCACAUUGCCAGGGAUUACC | ||||
| miR-28 | 4706 | 4712 | 1A | hsa-miR-28brain | AAGGAGCUCACAGUCUAUUGAG |
| miR-30-5p | 1419 | 1425 | 1A | hsa-miR-30a-5p | UGUAAACAUCCUCGACUGGAAG |
| hsa-miR-30cbrain | UGUAAACAUCCUACACUCUCAGC | ||||
| hsa-miR-30dSZ | UGUAAACAUCCCCGACUGGAAG | ||||
| hsa-miR-30bSZ | UGUAAACAUCCUACACUCAGCU | ||||
| hsa-miR-30e-5p | UGUAAACAUCCUUGACUGGA | ||||
| miR-323 | 5325 | 5331 | 1A | hsa-miR-323brain | GCACAUUACACGGUCGACCUCU |
| miR-376 | 1149 | 1155 | 1A | hsa-miR-376a | AUCAUAGAGGAAAAUCCACGU |
| hsa-miR-376b | AUCAUAGAGGAAAAUCCAUGUU | ||||
| miR-409-5p | 887 | 893 | 1A | hsa-miR-409-5p | AGGUUACCCGAGCAACUUUGCA |
| miR-410 | 1204 | 1210 | 1A | hsa-miR-410 | AAUAUAACACAGAUGGCCUGU |
| miR-433-3p | 1401 | 1407 | 1A | hsa-miR-433brain | AUCAUGAUGGGCUCCUCGGUGU |
| miR-496 | 1195 | 1201 | 1A | hsa-miR-496 | AUUACAUGGCCAAUCUC |
- SZ: miRNAs which differentially expressed in brain cortex of schizophrenia patients comparing with control samples using microarray. Click here to see the list of SZ related miRNAs.
- Brain: miRNAs which are expressed in brain based on miRNA microarray expression studies. Click here to see the list of brain related miRNAs.