Gene Page: SLC10A3
Summary ?
| GeneID | 8273 |
| Symbol | SLC10A3 |
| Synonyms | DXS253E|P3 |
| Description | solute carrier family 10 member 3 |
| Reference | MIM:312090|HGNC:HGNC:22979|Ensembl:ENSG00000126903|HPRD:02418|Vega:OTTHUMG00000013369 |
| Gene type | protein-coding |
| Map location | Xq28 |
| Fetal beta | -0.436 |
| DMG | 1 (# studies) |
| eGene | Myers' cis & trans |
Gene in Data Sources
| Gene set name | Method of gene set | Description | Info |
|---|---|---|---|
| CV:PGCnp | Genome-wide Association Study | GWAS | |
| DMG:vanEijk_2014 | Genome-wide DNA methylation analysis | This dataset includes 432 differentially methylated CpG sites corresponding to 391 unique transcripts between schizophrenia patients (n=260) and unaffected controls (n=250). | 3 |
Section I. Genetics and epigenetics annotation
 Differentially methylated gene
| Probe | Chromosome | Position | Nearest gene | P (dis) | Beta (dis) | FDR (dis) | Study |
|---|---|---|---|---|---|---|---|
| cg03672021 | X | 153602658 | SLC10A3 | 4.634E-4 | 5.292 | DMG:vanEijk_2014 | |
| cg20641280 | X | 153707793 | SLC10A3 | 4.823E-4 | 4.927 | DMG:vanEijk_2014 | |
| cg09202373 | X | 153640674 | SLC10A3 | 4.743E-4 | 4.418 | DMG:vanEijk_2014 |
eQTL annotation
| SNP ID | Chromosome | Position | eGene | Gene Entrez ID | pvalue | qvalue | TSS distance | eQTL type |
|---|---|---|---|---|---|---|---|---|
| rs928641 | chr9 | 119927509 | SLC10A3 | 8273 | 0.02 | trans | ||
| rs977937 | chr9 | 119942648 | SLC10A3 | 8273 | 0.02 | trans | ||
| rs17714461 | chr19 | 51425105 | SLC10A3 | 8273 | 0.06 | trans |
Section II. Transcriptome annotation
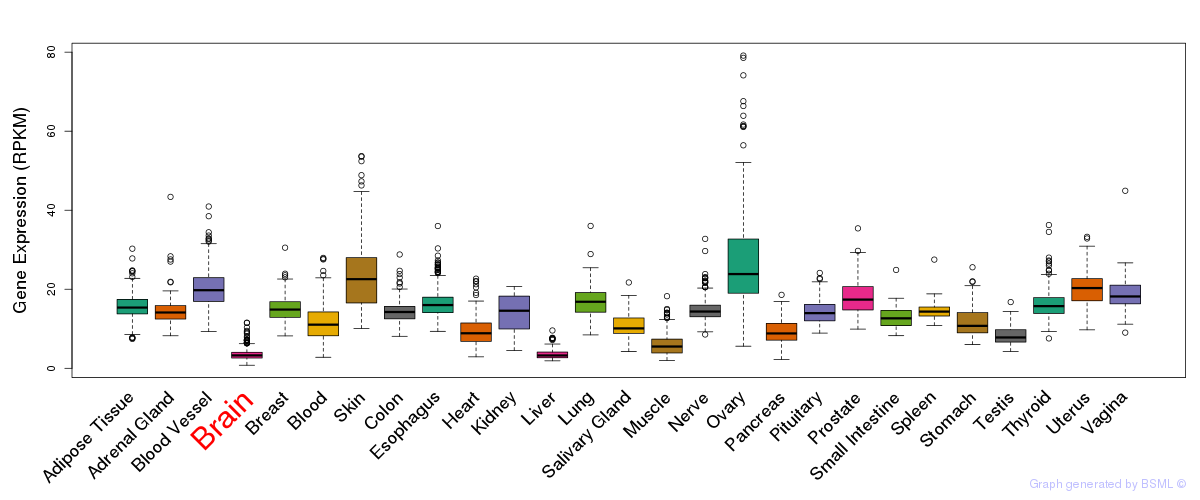
General gene expression (GTEx)
Gene expression during devlopment (BrainCloud)
Footnote:
A total of 269 time points ploted, with n=38 fetal samples (x=1:38). Each triangle represents one time point.
Gene expression of temporal and spatial changes (BrainSpan)
Footnote:
SC: sub-cortical regions; SM: sensory-motor regions; FC: frontal cortex; and TP: temporal-parietal cortex
ST1: fetal (13 - 26 postconception weeks), ST2: early infancy to late childhood (4 months to 11 years), and ST3: adolescence to adulthood (13 - 23 years)
The bar shown representes the lower 25% and upper 25% of the expression distribution.
No co-expressed genes in brain regions
Section V. Pathway annotation
| Pathway name | Pathway size | # SZGR 2.0 genes in pathway | Info |
|---|---|---|---|
| LIU CMYB TARGETS UP | 165 | 106 | All SZGR 2.0 genes in this pathway |
| WANG LMO4 TARGETS UP | 372 | 227 | All SZGR 2.0 genes in this pathway |
| KIM WT1 TARGETS 12HR UP | 162 | 116 | All SZGR 2.0 genes in this pathway |
| YAGI AML SURVIVAL | 129 | 87 | All SZGR 2.0 genes in this pathway |
| REN ALVEOLAR RHABDOMYOSARCOMA DN | 408 | 274 | All SZGR 2.0 genes in this pathway |
| RAMASWAMY METASTASIS DN | 61 | 47 | All SZGR 2.0 genes in this pathway |
| MONNIER POSTRADIATION TUMOR ESCAPE UP | 393 | 244 | All SZGR 2.0 genes in this pathway |
| MILI PSEUDOPODIA CHEMOTAXIS DN | 457 | 302 | All SZGR 2.0 genes in this pathway |
| MILI PSEUDOPODIA HAPTOTAXIS DN | 668 | 419 | All SZGR 2.0 genes in this pathway |
| VERHAAK GLIOBLASTOMA MESENCHYMAL | 216 | 130 | All SZGR 2.0 genes in this pathway |
| ACOSTA PROLIFERATION INDEPENDENT MYC TARGETS DN | 116 | 74 | All SZGR 2.0 genes in this pathway |
| BHAT ESR1 TARGETS VIA AKT1 UP | 281 | 183 | All SZGR 2.0 genes in this pathway |
| KRIEG HYPOXIA NOT VIA KDM3A | 770 | 480 | All SZGR 2.0 genes in this pathway |