Gene Page: SCRT1
Summary ?
| GeneID | 83482 |
| Symbol | SCRT1 |
| Synonyms | SCRT|ZNF898 |
| Description | scratch family zinc finger 1 |
| Reference | MIM:605858|HGNC:HGNC:15950|Ensembl:ENSG00000261678|HPRD:16166|Vega:OTTHUMG00000165229 |
| Gene type | protein-coding |
| Map location | 8q24.3 |
| Pascal p-value | 0.292 |
| Fetal beta | -0.431 |
| DMG | 1 (# studies) |
Gene in Data Sources
| Gene set name | Method of gene set | Description | Info |
|---|---|---|---|
| CV:PGCnp | Genome-wide Association Study | GWAS | |
| DMG:Wockner_2014 | Genome-wide DNA methylation analysis | This dataset includes 4641 differentially methylated probes corresponding to 2929 unique genes between schizophrenia patients (n=24) and controls (n=24). | 1 |
Section I. Genetics and epigenetics annotation
 Differentially methylated gene
| Probe | Chromosome | Position | Nearest gene | P (dis) | Beta (dis) | FDR (dis) | Study |
|---|---|---|---|---|---|---|---|
| cg07918726 | 8 | 145559963 | SCRT1 | 1.885E-4 | -0.335 | 0.034 | DMG:Wockner_2014 |
Section II. Transcriptome annotation
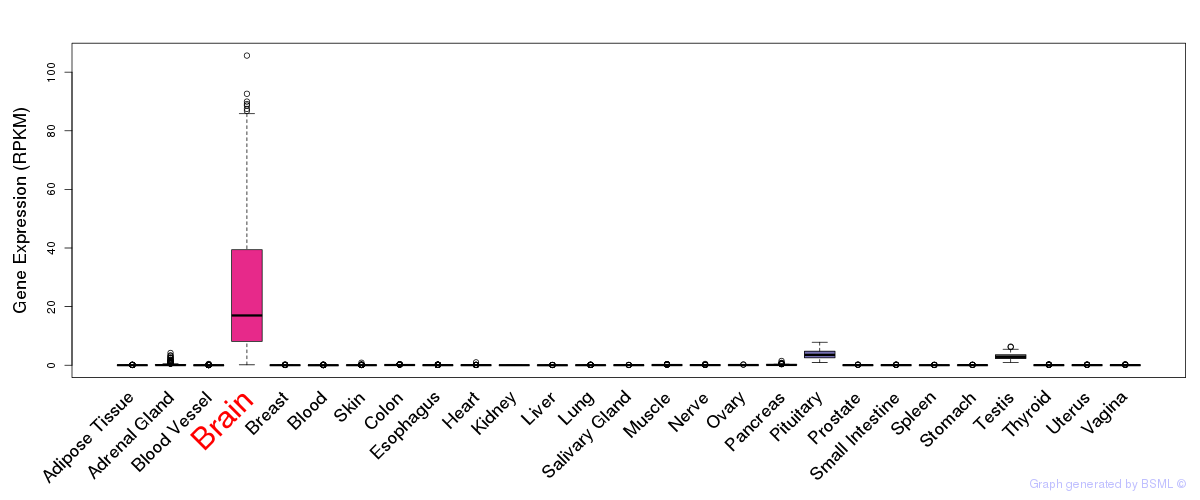
General gene expression (GTEx)
Gene expression during devlopment (BrainCloud)
Footnote:
A total of 269 time points ploted, with n=38 fetal samples (x=1:38). Each triangle represents one time point.
Gene expression of temporal and spatial changes (BrainSpan)
Footnote:
SC: sub-cortical regions; SM: sensory-motor regions; FC: frontal cortex; and TP: temporal-parietal cortex
ST1: fetal (13 - 26 postconception weeks), ST2: early infancy to late childhood (4 months to 11 years), and ST3: adolescence to adulthood (13 - 23 years)
The bar shown representes the lower 25% and upper 25% of the expression distribution.
Top co-expressed genes in brain regions
| Top 10 positively co-expressed genes | ||
| Gene | Pearson's Correlation | Spearman's Correlation |
| STK36 | 0.87 | 0.84 |
| HYDIN | 0.86 | 0.83 |
| TARBP1 | 0.84 | 0.84 |
| KIAA1407 | 0.84 | 0.75 |
| THBS3 | 0.84 | 0.77 |
| KIAA1683 | 0.83 | 0.77 |
| MAPK15 | 0.83 | 0.55 |
| AC022382.1 | 0.82 | 0.85 |
| CCDC37 | 0.82 | 0.62 |
| WSB1 | 0.80 | 0.84 |
| Top 10 negatively co-expressed genes | ||
| Gene | Pearson's Correlation | Spearman's Correlation |
| AF347015.31 | -0.39 | -0.45 |
| ABCG2 | -0.38 | -0.42 |
| AF347015.27 | -0.37 | -0.42 |
| GIMAP5 | -0.37 | -0.46 |
| IFI27 | -0.37 | -0.43 |
| MT-CO2 | -0.36 | -0.42 |
| TM4SF18 | -0.36 | -0.44 |
| COX4I2 | -0.36 | -0.42 |
| TM4SF1 | -0.35 | -0.39 |
| AF347015.21 | -0.35 | -0.51 |
Section V. Pathway annotation
| Pathway name | Pathway size | # SZGR 2.0 genes in pathway | Info |
|---|---|---|---|
| KIM WT1 TARGETS DN | 459 | 276 | All SZGR 2.0 genes in this pathway |
| MEISSNER BRAIN HCP WITH H3K4ME3 AND H3K27ME3 | 1069 | 729 | All SZGR 2.0 genes in this pathway |
| MEISSNER NPC HCP WITH H3K4ME2 AND H3K27ME3 | 349 | 234 | All SZGR 2.0 genes in this pathway |
| MIKKELSEN MCV6 HCP WITH H3K27ME3 | 435 | 318 | All SZGR 2.0 genes in this pathway |
| MIKKELSEN NPC HCP WITH H3K27ME3 | 341 | 243 | All SZGR 2.0 genes in this pathway |
| MIKKELSEN MEF HCP WITH H3K27ME3 | 590 | 403 | All SZGR 2.0 genes in this pathway |
| WAKABAYASHI ADIPOGENESIS PPARG BOUND 8D | 658 | 397 | All SZGR 2.0 genes in this pathway |