Gene Page: BCO2
Summary ?
| GeneID | 83875 |
| Symbol | BCO2 |
| Synonyms | B-DIOX-II|BCDO2 |
| Description | beta-carotene oxygenase 2 |
| Reference | MIM:611740|HGNC:HGNC:18503|Ensembl:ENSG00000197580|HPRD:12522|Vega:OTTHUMG00000167155 |
| Gene type | protein-coding |
| Map location | 11q23.1 |
| Pascal p-value | 0.588 |
| Fetal beta | -0.669 |
| DMG | 1 (# studies) |
| eGene | Anterior cingulate cortex BA24 Caudate basal ganglia Cerebellar Hemisphere Cerebellum Cortex Frontal Cortex BA9 Hypothalamus Nucleus accumbens basal ganglia Putamen basal ganglia Myers' cis & trans |
Gene in Data Sources
| Gene set name | Method of gene set | Description | Info |
|---|---|---|---|
| CV:PGCnp | Genome-wide Association Study | GWAS | |
| DMG:Wockner_2014 | Genome-wide DNA methylation analysis | This dataset includes 4641 differentially methylated probes corresponding to 2929 unique genes between schizophrenia patients (n=24) and controls (n=24). | 1 |
Section I. Genetics and epigenetics annotation
 Differentially methylated gene
| Probe | Chromosome | Position | Nearest gene | P (dis) | Beta (dis) | FDR (dis) | Study |
|---|---|---|---|---|---|---|---|
| cg01015175 | 11 | 112045641 | BCO2 | 5.938E-4 | -0.54 | 0.05 | DMG:Wockner_2014 |
eQTL annotation
| SNP ID | Chromosome | Position | eGene | Gene Entrez ID | pvalue | qvalue | TSS distance | eQTL type |
|---|---|---|---|---|---|---|---|---|
| rs2140736 | chr15 | 31159211 | BCO2 | 83875 | 0.12 | trans | ||
| rs2948491 | chrX | 40180688 | BCO2 | 83875 | 0.06 | trans | ||
| rs200332020 | 11 | 112065737 | BCO2 | ENSG00000197580.7 | 1.494E-6 | 0.04 | 19547 | gtex_brain_ba24 |
| rs199726061 | 11 | 112065742 | BCO2 | ENSG00000197580.7 | 1.494E-6 | 0.04 | 19552 | gtex_brain_ba24 |
| rs562156146 | 11 | 112065743 | BCO2 | ENSG00000197580.7 | 1.429E-6 | 0.04 | 19553 | gtex_brain_ba24 |
| rs11214138 | 11 | 112084061 | BCO2 | ENSG00000197580.7 | 1.714E-6 | 0.04 | 37871 | gtex_brain_ba24 |
| rs12283162 | 11 | 112057306 | BCO2 | ENSG00000197580.7 | 1.642E-6 | 0.02 | 11116 | gtex_brain_putamen_basal |
| rs56475786 | 11 | 112058408 | BCO2 | ENSG00000197580.7 | 1.457E-6 | 0.02 | 12218 | gtex_brain_putamen_basal |
| rs10891335 | 11 | 112059277 | BCO2 | ENSG00000197580.7 | 1.453E-6 | 0.02 | 13087 | gtex_brain_putamen_basal |
| rs11214120 | 11 | 112059715 | BCO2 | ENSG00000197580.7 | 1.453E-6 | 0.02 | 13525 | gtex_brain_putamen_basal |
| rs10891336 | 11 | 112061441 | BCO2 | ENSG00000197580.7 | 1.226E-6 | 0.02 | 15251 | gtex_brain_putamen_basal |
| rs10891337 | 11 | 112063254 | BCO2 | ENSG00000197580.7 | 1.451E-6 | 0.02 | 17064 | gtex_brain_putamen_basal |
| rs200332020 | 11 | 112065737 | BCO2 | ENSG00000197580.7 | 1.228E-6 | 0.02 | 19547 | gtex_brain_putamen_basal |
| rs199726061 | 11 | 112065742 | BCO2 | ENSG00000197580.7 | 2.77E-6 | 0.02 | 19552 | gtex_brain_putamen_basal |
| rs562156146 | 11 | 112065743 | BCO2 | ENSG00000197580.7 | 2.002E-6 | 0.02 | 19553 | gtex_brain_putamen_basal |
| rs11214127 | 11 | 112068593 | BCO2 | ENSG00000197580.7 | 1.374E-6 | 0.02 | 22403 | gtex_brain_putamen_basal |
| rs11214128 | 11 | 112068758 | BCO2 | ENSG00000197580.7 | 1.45E-6 | 0.02 | 22568 | gtex_brain_putamen_basal |
| rs10891339 | 11 | 112070174 | BCO2 | ENSG00000197580.7 | 1.425E-6 | 0.02 | 23984 | gtex_brain_putamen_basal |
| rs11214134 | 11 | 112080424 | BCO2 | ENSG00000197580.7 | 1.281E-6 | 0.02 | 34234 | gtex_brain_putamen_basal |
| rs11214135 | 11 | 112081208 | BCO2 | ENSG00000197580.7 | 1.272E-6 | 0.02 | 35018 | gtex_brain_putamen_basal |
| rs11214138 | 11 | 112084061 | BCO2 | ENSG00000197580.7 | 1.546E-6 | 0.02 | 37871 | gtex_brain_putamen_basal |
Section II. Transcriptome annotation
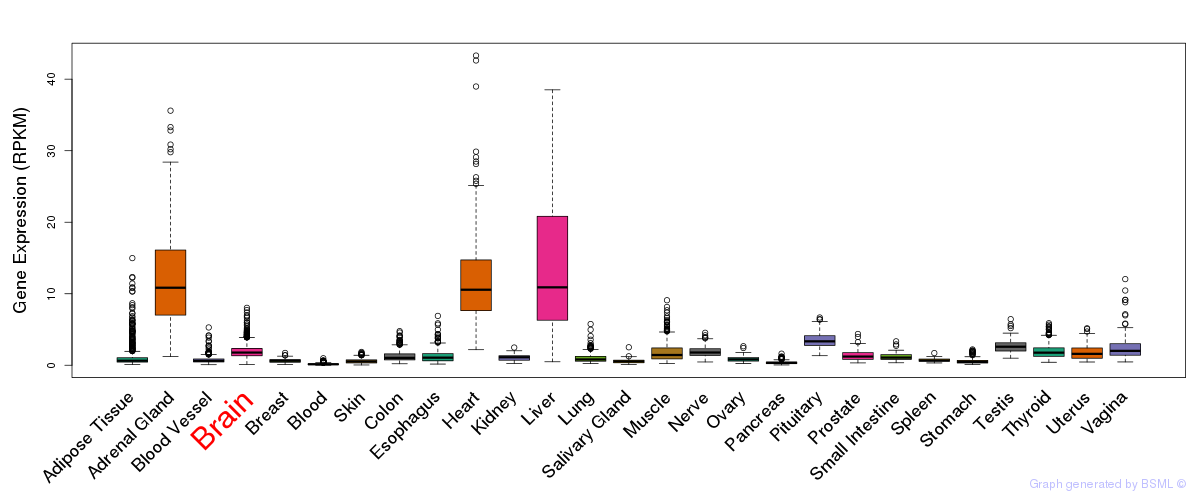
General gene expression (GTEx)
Gene expression during devlopment (BrainCloud)
Footnote:
A total of 269 time points ploted, with n=38 fetal samples (x=1:38). Each triangle represents one time point.
Gene expression of temporal and spatial changes (BrainSpan)
Footnote:
SC: sub-cortical regions; SM: sensory-motor regions; FC: frontal cortex; and TP: temporal-parietal cortex
ST1: fetal (13 - 26 postconception weeks), ST2: early infancy to late childhood (4 months to 11 years), and ST3: adolescence to adulthood (13 - 23 years)
The bar shown representes the lower 25% and upper 25% of the expression distribution.
No co-expressed genes in brain regions
Section III. Gene Ontology annotation
| Molecular function | GO term | Evidence | Neuro keywords | PubMed ID |
|---|---|---|---|---|
| GO:0005506 | iron ion binding | IEA | - | |
| GO:0016702 | oxidoreductase activity, acting on single donors with incorporation of molecular oxygen, incorporation of two atoms of oxygen | IDA | 11278918 | |
| GO:0016702 | oxidoreductase activity, acting on single donors with incorporation of molecular oxygen, incorporation of two atoms of oxygen | IEA | - | |
| GO:0016491 | oxidoreductase activity | IEA | - | |
| Biological process | GO term | Evidence | Neuro keywords | PubMed ID |
| GO:0016119 | carotene metabolic process | IDA | 11278918 | |
| GO:0016119 | carotene metabolic process | IEA | - | |
| GO:0042573 | retinoic acid metabolic process | NAS | 11278918 | |
| GO:0042574 | retinal metabolic process | NAS | 11278918 | |
| GO:0055114 | oxidation reduction | IEA | - | |
| Cellular component | GO term | Evidence | Neuro keywords | PubMed ID |
| GO:0005622 | intracellular | IC | 11278918 |
Section V. Pathway annotation
| Pathway name | Pathway size | # SZGR 2.0 genes in pathway | Info |
|---|---|---|---|
| SENGUPTA NASOPHARYNGEAL CARCINOMA DN | 349 | 157 | All SZGR 2.0 genes in this pathway |
| DODD NASOPHARYNGEAL CARCINOMA UP | 1821 | 933 | All SZGR 2.0 genes in this pathway |
| LASTOWSKA NEUROBLASTOMA COPY NUMBER DN | 800 | 473 | All SZGR 2.0 genes in this pathway |
| SHEPARD BMYB MORPHOLINO UP | 205 | 126 | All SZGR 2.0 genes in this pathway |
| TUOMISTO TUMOR SUPPRESSION BY COL13A1 DN | 17 | 11 | All SZGR 2.0 genes in this pathway |
| GAVIN FOXP3 TARGETS CLUSTER P3 | 160 | 103 | All SZGR 2.0 genes in this pathway |
| MCCABE BOUND BY HOXC6 | 469 | 239 | All SZGR 2.0 genes in this pathway |
| MCCABE HOXC6 TARGETS UP | 10 | 8 | All SZGR 2.0 genes in this pathway |
| MCCABE HOXC6 TARGETS CANCER UP | 31 | 23 | All SZGR 2.0 genes in this pathway |
| ACEVEDO NORMAL TISSUE ADJACENT TO LIVER TUMOR DN | 354 | 216 | All SZGR 2.0 genes in this pathway |
| ACEVEDO LIVER CANCER DN | 540 | 340 | All SZGR 2.0 genes in this pathway |
| TOYOTA TARGETS OF MIR34B AND MIR34C | 463 | 262 | All SZGR 2.0 genes in this pathway |
| FEVR CTNNB1 TARGETS UP | 682 | 433 | All SZGR 2.0 genes in this pathway |
Section VI. microRNA annotation
| miRNA family | Target position | miRNA ID | miRNA seq | ||
|---|---|---|---|---|---|
| UTR start | UTR end | Match method | |||
| miR-182 | 565 | 571 | 1A | hsa-miR-182 | UUUGGCAAUGGUAGAACUCACA |
| miR-338 | 472 | 478 | 1A | hsa-miR-338brain | UCCAGCAUCAGUGAUUUUGUUGA |
| miR-96 | 565 | 571 | 1A | hsa-miR-96brain | UUUGGCACUAGCACAUUUUUGC |
- SZ: miRNAs which differentially expressed in brain cortex of schizophrenia patients comparing with control samples using microarray. Click here to see the list of SZ related miRNAs.
- Brain: miRNAs which are expressed in brain based on miRNA microarray expression studies. Click here to see the list of brain related miRNAs.