Gene Page: CHCHD6
Summary ?
| GeneID | 84303 |
| Symbol | CHCHD6 |
| Synonyms | CHCM1|Mic25|PPP1R23 |
| Description | coiled-coil-helix-coiled-coil-helix domain containing 6 |
| Reference | MIM:615634|HGNC:HGNC:28184|Ensembl:ENSG00000159685|HPRD:13047|Vega:OTTHUMG00000159601 |
| Gene type | protein-coding |
| Map location | 3q21.3 |
| Pascal p-value | 0.057 |
| Sherlock p-value | 0.15 |
| Fetal beta | -0.125 |
| DMG | 1 (# studies) |
| eGene | Myers' cis & trans |
| Support | G2Cdb.human_BAYES-COLLINS-HUMAN-PSD-CONSENSUS G2Cdb.human_BAYES-COLLINS-HUMAN-PSD-FULL G2Cdb.human_BAYES-COLLINS-MOUSE-PSD-CONSENSUS G2Cdb.human_mitochondria CompositeSet |
Gene in Data Sources
| Gene set name | Method of gene set | Description | Info |
|---|---|---|---|
| CV:PGCnp | Genome-wide Association Study | GWAS | |
| DMG:Wockner_2014 | Genome-wide DNA methylation analysis | This dataset includes 4641 differentially methylated probes corresponding to 2929 unique genes between schizophrenia patients (n=24) and controls (n=24). | 1 |
Section I. Genetics and epigenetics annotation
 Differentially methylated gene
| Probe | Chromosome | Position | Nearest gene | P (dis) | Beta (dis) | FDR (dis) | Study |
|---|---|---|---|---|---|---|---|
| cg00336291 | 3 | 126668519 | CHCHD6 | 2.77E-5 | 0.29 | 0.018 | DMG:Wockner_2014 |
eQTL annotation
| SNP ID | Chromosome | Position | eGene | Gene Entrez ID | pvalue | qvalue | TSS distance | eQTL type |
|---|---|---|---|---|---|---|---|---|
| rs4127445 | chr18 | 65421319 | CHCHD6 | 84303 | 0.2 | trans |
Section II. Transcriptome annotation
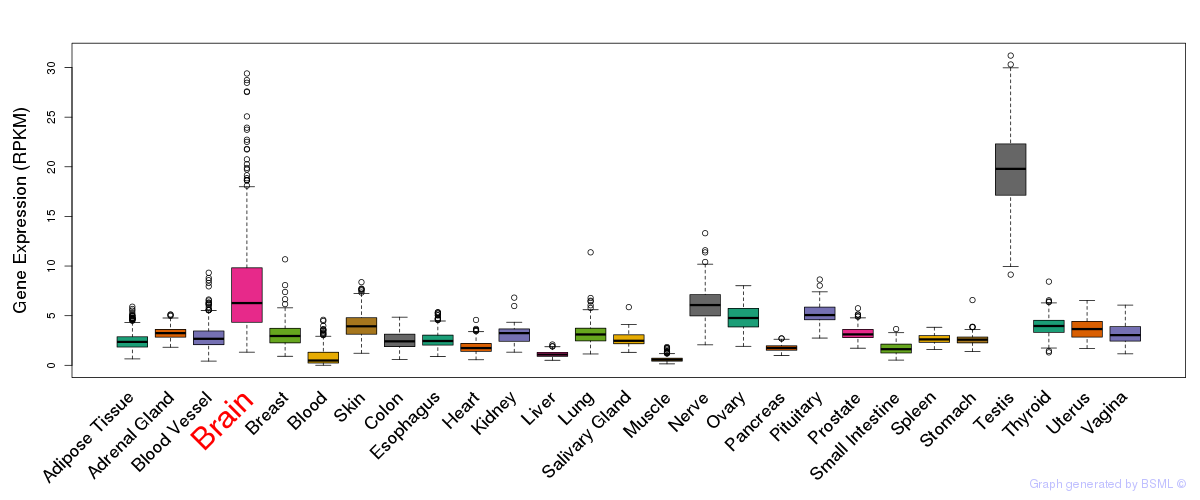
General gene expression (GTEx)
Gene expression during devlopment (BrainCloud)
Footnote:
A total of 269 time points ploted, with n=38 fetal samples (x=1:38). Each triangle represents one time point.
Gene expression of temporal and spatial changes (BrainSpan)
Footnote:
SC: sub-cortical regions; SM: sensory-motor regions; FC: frontal cortex; and TP: temporal-parietal cortex
ST1: fetal (13 - 26 postconception weeks), ST2: early infancy to late childhood (4 months to 11 years), and ST3: adolescence to adulthood (13 - 23 years)
The bar shown representes the lower 25% and upper 25% of the expression distribution.
No co-expressed genes in brain regions
Section V. Pathway annotation
| Pathway name | Pathway size | # SZGR 2.0 genes in pathway | Info |
|---|---|---|---|
| RICKMAN TUMOR DIFFERENTIATED WELL VS POORLY UP | 236 | 139 | All SZGR 2.0 genes in this pathway |
| MATSUDA NATURAL KILLER DIFFERENTIATION | 475 | 313 | All SZGR 2.0 genes in this pathway |
| IVANOVA HEMATOPOIESIS STEM CELL AND PROGENITOR | 681 | 420 | All SZGR 2.0 genes in this pathway |
| BOYLAN MULTIPLE MYELOMA C D UP | 139 | 95 | All SZGR 2.0 genes in this pathway |
| YOSHIMURA MAPK8 TARGETS UP | 1305 | 895 | All SZGR 2.0 genes in this pathway |
| CHEN METABOLIC SYNDROM NETWORK | 1210 | 725 | All SZGR 2.0 genes in this pathway |
| BRUINS UVC RESPONSE EARLY LATE | 317 | 190 | All SZGR 2.0 genes in this pathway |
| PURBEY TARGETS OF CTBP1 NOT SATB1 UP | 344 | 215 | All SZGR 2.0 genes in this pathway |
| WAKABAYASHI ADIPOGENESIS PPARG BOUND 8D | 658 | 397 | All SZGR 2.0 genes in this pathway |