Gene Page: APOPT1
Summary ?
| GeneID | 84334 |
| Symbol | APOPT1 |
| Synonyms | APOP|APOP1|C14orf153 |
| Description | apoptogenic 1, mitochondrial |
| Reference | MIM:616003|HGNC:HGNC:20492|Ensembl:ENSG00000256053|HPRD:12637|Vega:OTTHUMG00000153929 |
| Gene type | protein-coding |
| Map location | 14q32.33 |
| Sherlock p-value | 0.906 |
| eGene | Putamen basal ganglia |
Gene in Data Sources
| Gene set name | Method of gene set | Description | Info |
|---|---|---|---|
| CV:GWAScat | Genome-wide Association Studies | This data set includes 560 SNPs associated with schizophrenia. A total of 486 genes were mapped to these SNPs within 50kb. | |
| CV:PGC128 | Genome-wide Association Study | A multi-stage schizophrenia GWAS of up to 36,989 cases and 113,075 controls. Reported by the Schizophrenia Working Group of PGC. 128 independent associations spanning 108 loci | |
| CV:PGCnp | Genome-wide Association Study | GWAS |
Section I. Genetics and epigenetics annotation
 CV:PGC128
| SNP ID | Chromosome | Position | Allele | P | Function | Gene | Up/Down Distance |
|---|---|---|---|---|---|---|---|
| rs12887734 | chr14 | 104046834 | TG | 1.172E-13 | intronic | APOPT1 |
eQTL annotation
| SNP ID | Chromosome | Position | eGene | Gene Entrez ID | pvalue | qvalue | TSS distance | eQTL type |
|---|---|---|---|---|---|---|---|---|
| rs2372020 | chr7 | 83668573 | C14orf153 | 84334 | 0.14 | trans | ||
| snp_a-4294991 | 0 | C14orf153 | 84334 | 0.07 | trans | |||
| rs11793484 | chr9 | 317239 | C14orf153 | 84334 | 0.03 | trans | ||
| rs10970457 | chr9 | 326183 | C14orf153 | 84334 | 0.03 | trans | ||
| rs12255258 | chr10 | 106306927 | C14orf153 | 84334 | 0.08 | trans | ||
| rs6529624 | chrX | 133499961 | C14orf153 | 84334 | 0.06 | trans | ||
| rs11160752 | 14 | 103992096 | APOPT1 | ENSG00000256053.3 | 3.188E-6 | 0 | -37412 | gtex_brain_putamen_basal |
| rs2296487 | 14 | 103996205 | APOPT1 | ENSG00000256053.3 | 1.587E-6 | 0 | -33303 | gtex_brain_putamen_basal |
| rs2756138 | 14 | 103996733 | APOPT1 | ENSG00000256053.3 | 1.558E-6 | 0 | -32775 | gtex_brain_putamen_basal |
| rs2021965 | 14 | 103997248 | APOPT1 | ENSG00000256053.3 | 1.54E-6 | 0 | -32260 | gtex_brain_putamen_basal |
| rs12891288 | 14 | 103999750 | APOPT1 | ENSG00000256053.3 | 2.924E-7 | 0 | -29758 | gtex_brain_putamen_basal |
| rs2236281 | 14 | 104000518 | APOPT1 | ENSG00000256053.3 | 1.449E-6 | 0 | -28990 | gtex_brain_putamen_basal |
| rs7161305 | 14 | 104002234 | APOPT1 | ENSG00000256053.3 | 2.101E-6 | 0 | -27274 | gtex_brain_putamen_basal |
| rs34235720 | 14 | 104004968 | APOPT1 | ENSG00000256053.3 | 2.262E-6 | 0 | -24540 | gtex_brain_putamen_basal |
| rs12880077 | 14 | 104006342 | APOPT1 | ENSG00000256053.3 | 8.068E-7 | 0 | -23166 | gtex_brain_putamen_basal |
| rs12880224 | 14 | 104006414 | APOPT1 | ENSG00000256053.3 | 1.131E-6 | 0 | -23094 | gtex_brain_putamen_basal |
| rs9324063 | 14 | 104006693 | APOPT1 | ENSG00000256053.3 | 3.818E-7 | 0 | -22815 | gtex_brain_putamen_basal |
| rs12147596 | 14 | 104006716 | APOPT1 | ENSG00000256053.3 | 1.122E-6 | 0 | -22792 | gtex_brain_putamen_basal |
| rs12891360 | 14 | 104008159 | APOPT1 | ENSG00000256053.3 | 2.092E-7 | 0 | -21349 | gtex_brain_putamen_basal |
| rs34633710 | 14 | 104009630 | APOPT1 | ENSG00000256053.3 | 3.169E-6 | 0 | -19878 | gtex_brain_putamen_basal |
| rs2403194 | 14 | 104011429 | APOPT1 | ENSG00000256053.3 | 2.748E-7 | 0 | -18079 | gtex_brain_putamen_basal |
| rs12893668 | 14 | 104017793 | APOPT1 | ENSG00000256053.3 | 1.27E-6 | 0 | -11715 | gtex_brain_putamen_basal |
| rs12147645 | 14 | 104100208 | APOPT1 | ENSG00000256053.3 | 5.118E-7 | 0 | 70700 | gtex_brain_putamen_basal |
| rs8021229 | 14 | 104157578 | APOPT1 | ENSG00000256053.3 | 1.706E-6 | 0 | 128070 | gtex_brain_putamen_basal |
| rs59092643 | 14 | 104169988 | APOPT1 | ENSG00000256053.3 | 1.459E-6 | 0 | 140480 | gtex_brain_putamen_basal |
| rs35311561 | 14 | 104188127 | APOPT1 | ENSG00000256053.3 | 9.84E-7 | 0 | 158619 | gtex_brain_putamen_basal |
| rs12894657 | 14 | 104188920 | APOPT1 | ENSG00000256053.3 | 1.823E-6 | 0 | 159412 | gtex_brain_putamen_basal |
| rs56168984 | 14 | 104189857 | APOPT1 | ENSG00000256053.3 | 8.93E-7 | 0 | 160349 | gtex_brain_putamen_basal |
| rs7143885 | 14 | 104191917 | APOPT1 | ENSG00000256053.3 | 1.364E-6 | 0 | 162409 | gtex_brain_putamen_basal |
| rs2295148 | 14 | 104195610 | APOPT1 | ENSG00000256053.3 | 3.053E-6 | 0 | 166102 | gtex_brain_putamen_basal |
| rs12433009 | 14 | 104196405 | APOPT1 | ENSG00000256053.3 | 3.065E-6 | 0 | 166897 | gtex_brain_putamen_basal |
| rs3742366 | 14 | 104198351 | APOPT1 | ENSG00000256053.3 | 2.342E-6 | 0 | 168843 | gtex_brain_putamen_basal |
| rs8548 | 14 | 104199580 | APOPT1 | ENSG00000256053.3 | 3.278E-6 | 0 | 170072 | gtex_brain_putamen_basal |
| rs7142769 | 14 | 104228841 | APOPT1 | ENSG00000256053.3 | 3.396E-6 | 0 | 199333 | gtex_brain_putamen_basal |
| rs12888002 | 14 | 104238647 | APOPT1 | ENSG00000256053.3 | 1.046E-6 | 0 | 209139 | gtex_brain_putamen_basal |
| rs58948234 | 14 | 104325846 | APOPT1 | ENSG00000256053.3 | 6.492E-7 | 0 | 296338 | gtex_brain_putamen_basal |
| rs12891477 | 14 | 104332759 | APOPT1 | ENSG00000256053.3 | 1.604E-6 | 0 | 303251 | gtex_brain_putamen_basal |
| rs6576009 | 14 | 104335229 | APOPT1 | ENSG00000256053.3 | 2.729E-6 | 0 | 305721 | gtex_brain_putamen_basal |
| rs10132641 | 14 | 104338258 | APOPT1 | ENSG00000256053.3 | 8.944E-8 | 0 | 308750 | gtex_brain_putamen_basal |
Section II. Transcriptome annotation
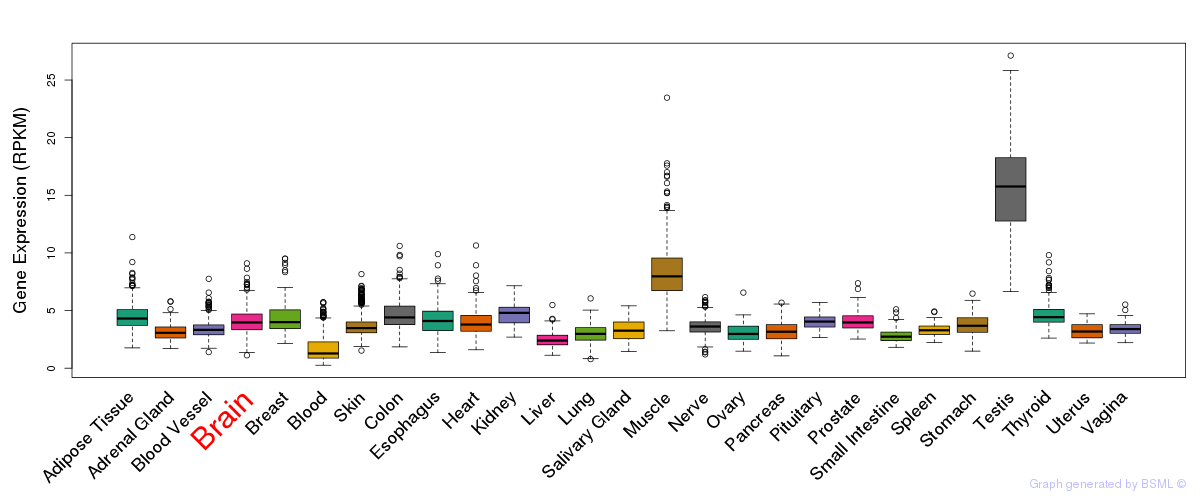
General gene expression (GTEx)
Gene expression of temporal and spatial changes (BrainSpan)
Footnote:
SC: sub-cortical regions; SM: sensory-motor regions; FC: frontal cortex; and TP: temporal-parietal cortex
ST1: fetal (13 - 26 postconception weeks), ST2: early infancy to late childhood (4 months to 11 years), and ST3: adolescence to adulthood (13 - 23 years)
The bar shown representes the lower 25% and upper 25% of the expression distribution.
No co-expressed genes in brain regions
Section V. Pathway annotation
| Pathway name | Pathway size | # SZGR 2.0 genes in pathway | Info |
|---|---|---|---|
| FULCHER INFLAMMATORY RESPONSE LECTIN VS LPS DN | 463 | 290 | All SZGR 2.0 genes in this pathway |
| MARTORIATI MDM4 TARGETS FETAL LIVER UP | 227 | 137 | All SZGR 2.0 genes in this pathway |
| DAIRKEE TERT TARGETS UP | 380 | 213 | All SZGR 2.0 genes in this pathway |
| BENPORATH NANOG TARGETS | 988 | 594 | All SZGR 2.0 genes in this pathway |
| BENPORATH OCT4 TARGETS | 290 | 172 | All SZGR 2.0 genes in this pathway |
| IVANOVA HEMATOPOIESIS LATE PROGENITOR | 544 | 307 | All SZGR 2.0 genes in this pathway |
| IWANAGA CARCINOGENESIS BY KRAS UP | 170 | 107 | All SZGR 2.0 genes in this pathway |
| YAUCH HEDGEHOG SIGNALING PARACRINE UP | 149 | 85 | All SZGR 2.0 genes in this pathway |
| BOYLAN MULTIPLE MYELOMA D UP | 89 | 62 | All SZGR 2.0 genes in this pathway |
| GOBERT OLIGODENDROCYTE DIFFERENTIATION DN | 1080 | 713 | All SZGR 2.0 genes in this pathway |