Gene Page: HPS3
Summary ?
| GeneID | 84343 |
| Symbol | HPS3 |
| Synonyms | BLOC2S1|SUTAL |
| Description | HPS3, biogenesis of lysosomal organelles complex 2 subunit 1 |
| Reference | MIM:606118|HGNC:HGNC:15597|Ensembl:ENSG00000163755|HPRD:05835|Vega:OTTHUMG00000159548 |
| Gene type | protein-coding |
| Map location | 3q24 |
| Pascal p-value | 0.128 |
| Fetal beta | 0.246 |
| eGene | Myers' cis & trans |
| Support | CompositeSet |
Gene in Data Sources
| Gene set name | Method of gene set | Description | Info |
|---|---|---|---|
| CV:PGCnp | Genome-wide Association Study | GWAS | |
| DNM:Fromer_2014 | Whole Exome Sequencing analysis | This study reported a WES study of 623 schizophrenia trios, reporting DNMs using genomic DNA. |
Section I. Genetics and epigenetics annotation
 DNM table
| Gene | Chromosome | Position | Ref | Alt | Transcript | AA change | Mutation type | Sift | CG46 | Trait | Study |
|---|---|---|---|---|---|---|---|---|---|---|---|
| HPS3 | chr3 | 148858887 | G | A | NM_032383 | p.266E>K | missense | Schizophrenia | DNM:Fromer_2014 |
eQTL annotation
| SNP ID | Chromosome | Position | eGene | Gene Entrez ID | pvalue | qvalue | TSS distance | eQTL type |
|---|---|---|---|---|---|---|---|---|
| rs6676085 | chr1 | 80017275 | HPS3 | 84343 | 0 | trans | ||
| rs1876946 | chr1 | 245459606 | HPS3 | 84343 | 0.06 | trans | ||
| rs10930065 | chr2 | 163558853 | HPS3 | 84343 | 0.04 | trans | ||
| rs16835159 | chr2 | 194205373 | HPS3 | 84343 | 0.14 | trans | ||
| rs1484507 | chr3 | 723754 | HPS3 | 84343 | 0.05 | trans | ||
| rs13066393 | chr3 | 729509 | HPS3 | 84343 | 0.01 | trans | ||
| rs17027208 | chr3 | 31219519 | HPS3 | 84343 | 0.13 | trans | ||
| rs10513561 | chr3 | 160711090 | HPS3 | 84343 | 0.13 | trans | ||
| rs17392097 | chr3 | 160717707 | HPS3 | 84343 | 0.09 | trans | ||
| rs17165041 | chr5 | 126676553 | HPS3 | 84343 | 0.04 | trans | ||
| rs197899 | chr6 | 95586706 | HPS3 | 84343 | 0.03 | trans | ||
| rs3884624 | chr6 | 96112071 | HPS3 | 84343 | 0.01 | trans | ||
| rs13221610 | chr7 | 24446908 | HPS3 | 84343 | 0.03 | trans | ||
| rs17155256 | chr7 | 81238710 | HPS3 | 84343 | 0.1 | trans | ||
| rs7781583 | chr7 | 81284872 | HPS3 | 84343 | 0.17 | trans | ||
| rs1501409 | chr7 | 121862246 | HPS3 | 84343 | 0.06 | trans | ||
| rs1031120 | chr7 | 121892154 | HPS3 | 84343 | 0.03 | trans | ||
| rs3757384 | 0 | HPS3 | 84343 | 0.11 | trans | |||
| rs7807249 | chr7 | 131615735 | HPS3 | 84343 | 0.05 | trans | ||
| rs1020252 | chr8 | 41563790 | HPS3 | 84343 | 0.02 | trans | ||
| rs17716548 | chr8 | 134339915 | HPS3 | 84343 | 0.06 | trans | ||
| rs17147724 | chr10 | 10351743 | HPS3 | 84343 | 0.12 | trans | ||
| rs12773940 | chr10 | 10358396 | HPS3 | 84343 | 0.12 | trans | ||
| rs17147755 | chr10 | 10371954 | HPS3 | 84343 | 0.12 | trans | ||
| rs12784285 | chr10 | 10372216 | HPS3 | 84343 | 0.09 | trans | ||
| rs10082400 | chr10 | 48463135 | HPS3 | 84343 | 0.06 | trans | ||
| rs11237240 | chr11 | 77322804 | HPS3 | 84343 | 0.04 | trans | ||
| rs1921050 | chr12 | 81706540 | HPS3 | 84343 | 0 | trans | ||
| rs10746188 | chr12 | 81718315 | HPS3 | 84343 | 0 | trans | ||
| rs12424630 | chr12 | 81743936 | HPS3 | 84343 | 0 | trans | ||
| rs7398686 | chr12 | 132047806 | HPS3 | 84343 | 0.13 | trans | ||
| rs17078797 | chr13 | 85500669 | HPS3 | 84343 | 0.06 | trans | ||
| rs9603986 | chr13 | 113556356 | HPS3 | 84343 | 0.12 | trans | ||
| rs12879906 | chr14 | 51442629 | HPS3 | 84343 | 0.09 | trans | ||
| rs9324006 | chr14 | 99505533 | HPS3 | 84343 | 0.1 | trans | ||
| rs16975717 | chr15 | 45135357 | HPS3 | 84343 | 0 | trans | ||
| rs12708423 | chr15 | 50795834 | HPS3 | 84343 | 0.01 | trans | ||
| rs17650694 | chr15 | 52568963 | HPS3 | 84343 | 0 | trans | ||
| rs16944607 | chr15 | 91135442 | HPS3 | 84343 | 0.08 | trans | ||
| rs1020065 | chr16 | 55369953 | HPS3 | 84343 | 0.13 | trans | ||
| rs6061663 | chr20 | 59967784 | HPS3 | 84343 | 0.11 | trans | ||
| rs9617982 | chr22 | 17792739 | HPS3 | 84343 | 0.18 | trans | ||
| rs714018 | chr22 | 34972633 | HPS3 | 84343 | 0.2 | trans |
Section II. Transcriptome annotation
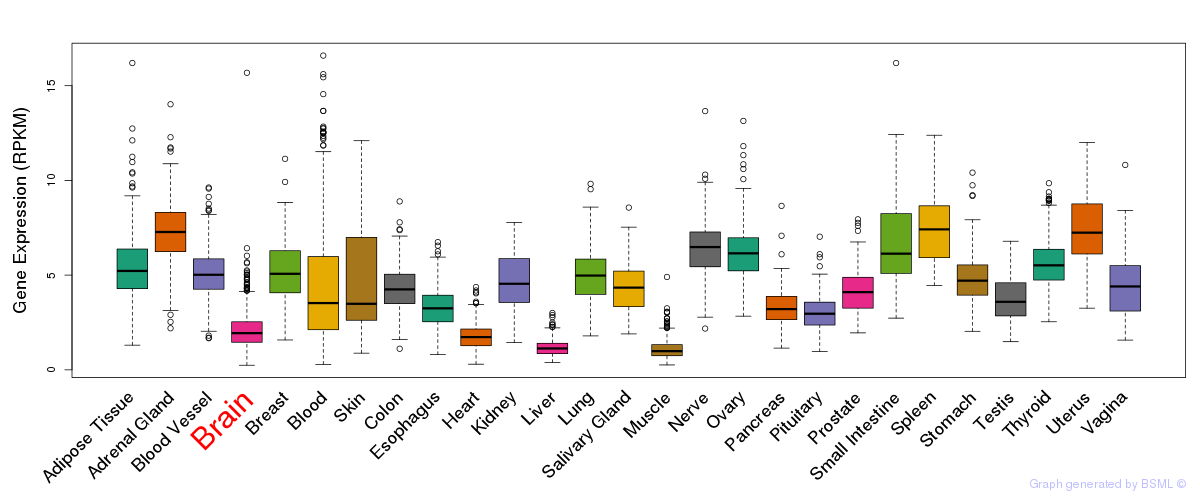
General gene expression (GTEx)
Gene expression during devlopment (BrainCloud)
Footnote:
A total of 269 time points ploted, with n=38 fetal samples (x=1:38). Each triangle represents one time point.
Gene expression of temporal and spatial changes (BrainSpan)
Footnote:
SC: sub-cortical regions; SM: sensory-motor regions; FC: frontal cortex; and TP: temporal-parietal cortex
ST1: fetal (13 - 26 postconception weeks), ST2: early infancy to late childhood (4 months to 11 years), and ST3: adolescence to adulthood (13 - 23 years)
The bar shown representes the lower 25% and upper 25% of the expression distribution.
No co-expressed genes in brain regions
Section V. Pathway annotation
| Pathway name | Pathway size | # SZGR 2.0 genes in pathway | Info |
|---|---|---|---|
| FULCHER INFLAMMATORY RESPONSE LECTIN VS LPS UP | 579 | 346 | All SZGR 2.0 genes in this pathway |
| RODRIGUES THYROID CARCINOMA POORLY DIFFERENTIATED UP | 633 | 376 | All SZGR 2.0 genes in this pathway |
| RODRIGUES THYROID CARCINOMA ANAPLASTIC UP | 722 | 443 | All SZGR 2.0 genes in this pathway |
| BENPORATH ES 1 | 379 | 235 | All SZGR 2.0 genes in this pathway |
| DOUGLAS BMI1 TARGETS UP | 566 | 371 | All SZGR 2.0 genes in this pathway |
| CREIGHTON ENDOCRINE THERAPY RESISTANCE 3 | 720 | 440 | All SZGR 2.0 genes in this pathway |
| QI PLASMACYTOMA UP | 259 | 185 | All SZGR 2.0 genes in this pathway |
| DUTERTRE ESTRADIOL RESPONSE 6HR DN | 91 | 56 | All SZGR 2.0 genes in this pathway |
| DUTERTRE ESTRADIOL RESPONSE 24HR DN | 505 | 328 | All SZGR 2.0 genes in this pathway |
| CHYLA CBFA2T3 TARGETS UP | 387 | 225 | All SZGR 2.0 genes in this pathway |