Gene Page: RASAL1
Summary ?
| GeneID | 8437 |
| Symbol | RASAL1 |
| Synonyms | RASAL |
| Description | RAS protein activator like 1 |
| Reference | MIM:604118|HGNC:HGNC:9873|Ensembl:ENSG00000111344|HPRD:04986|Vega:OTTHUMG00000169705 |
| Gene type | protein-coding |
| Map location | 12q23-q24 |
| Pascal p-value | 0.558 |
| Sherlock p-value | 0.807 |
| Fetal beta | -2.46 |
| eGene | Myers' cis & trans |
| Support | INTRACELLULAR SIGNAL TRANSDUCTION G2Cdb.human_BAYES-COLLINS-HUMAN-PSD-CONSENSUS |
Gene in Data Sources
| Gene set name | Method of gene set | Description | Info |
|---|---|---|---|
| CV:GWASdb | Genome-wide Association Studies | GWASdb records for schizophrenia | |
| CV:PGCnp | Genome-wide Association Study | GWAS |
Section I. Genetics and epigenetics annotation
 eQTL annotation
| SNP ID | Chromosome | Position | eGene | Gene Entrez ID | pvalue | qvalue | TSS distance | eQTL type |
|---|---|---|---|---|---|---|---|---|
| rs2809658 | chr1 | 43050395 | RASAL1 | 8437 | 0.07 | trans |
Section II. Transcriptome annotation
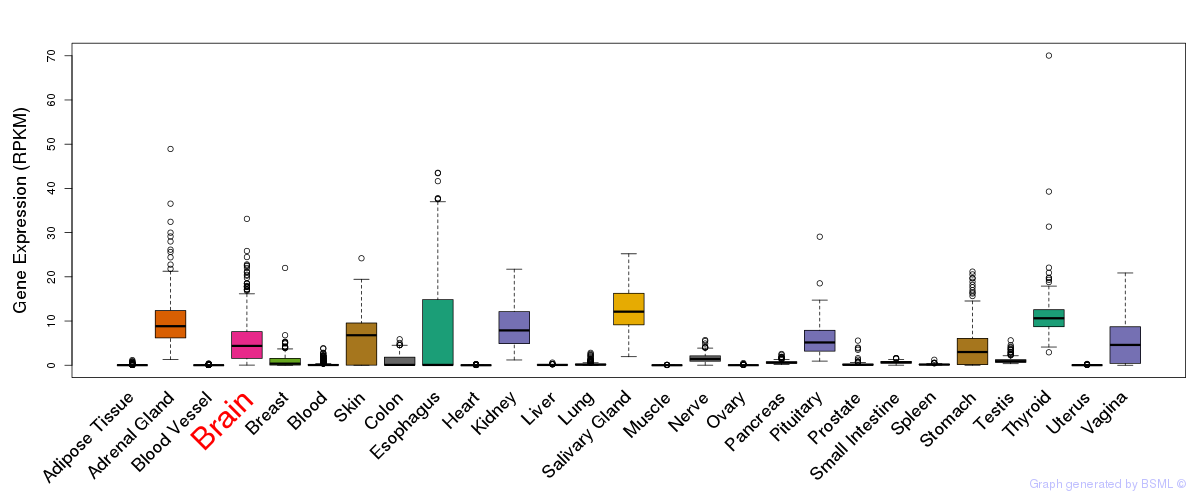
General gene expression (GTEx)
Gene expression during devlopment (BrainCloud)
Footnote:
A total of 269 time points ploted, with n=38 fetal samples (x=1:38). Each triangle represents one time point.
Gene expression of temporal and spatial changes (BrainSpan)
Footnote:
SC: sub-cortical regions; SM: sensory-motor regions; FC: frontal cortex; and TP: temporal-parietal cortex
ST1: fetal (13 - 26 postconception weeks), ST2: early infancy to late childhood (4 months to 11 years), and ST3: adolescence to adulthood (13 - 23 years)
The bar shown representes the lower 25% and upper 25% of the expression distribution.
Top co-expressed genes in brain regions
| Top 10 positively co-expressed genes | ||
| Gene | Pearson's Correlation | Spearman's Correlation |
| TNKS | 0.86 | 0.91 |
| HISPPD1 | 0.86 | 0.90 |
| KLHL9 | 0.84 | 0.89 |
| RNF180 | 0.84 | 0.86 |
| ZBTB41 | 0.83 | 0.85 |
| STX7 | 0.83 | 0.87 |
| CDK8 | 0.83 | 0.85 |
| SCAND3 | 0.83 | 0.85 |
| TES | 0.83 | 0.64 |
| AL136218.1 | 0.82 | 0.82 |
| Top 10 negatively co-expressed genes | ||
| Gene | Pearson's Correlation | Spearman's Correlation |
| FXYD1 | -0.57 | -0.81 |
| AF347015.31 | -0.57 | -0.78 |
| HLA-F | -0.57 | -0.69 |
| MT-CO2 | -0.56 | -0.79 |
| AC018755.7 | -0.56 | -0.67 |
| C5orf53 | -0.55 | -0.65 |
| TMEM54 | -0.55 | -0.58 |
| IFI27 | -0.55 | -0.79 |
| AF347015.33 | -0.55 | -0.75 |
| TSC22D4 | -0.55 | -0.70 |
Section V. Pathway annotation
| Pathway name | Pathway size | # SZGR 2.0 genes in pathway | Info |
|---|---|---|---|
| ST GA12 PATHWAY | 23 | 16 | All SZGR 2.0 genes in this pathway |
| PID RAS PATHWAY | 30 | 22 | All SZGR 2.0 genes in this pathway |
| DOANE RESPONSE TO ANDROGEN UP | 184 | 125 | All SZGR 2.0 genes in this pathway |
| ZHOU INFLAMMATORY RESPONSE FIMA UP | 544 | 308 | All SZGR 2.0 genes in this pathway |
| DODD NASOPHARYNGEAL CARCINOMA UP | 1821 | 933 | All SZGR 2.0 genes in this pathway |
| MOHANKUMAR TLX1 TARGETS DN | 193 | 112 | All SZGR 2.0 genes in this pathway |
| ROSS AML WITH AML1 ETO FUSION | 76 | 55 | All SZGR 2.0 genes in this pathway |
| BLALOCK ALZHEIMERS DISEASE DN | 1237 | 837 | All SZGR 2.0 genes in this pathway |
| HANN RESISTANCE TO BCL2 INHIBITOR DN | 48 | 31 | All SZGR 2.0 genes in this pathway |
| ENGELMANN CANCER PROGENITORS DN | 70 | 44 | All SZGR 2.0 genes in this pathway |
| SMID BREAST CANCER BASAL UP | 648 | 398 | All SZGR 2.0 genes in this pathway |
| LABBE TARGETS OF TGFB1 AND WNT3A UP | 111 | 70 | All SZGR 2.0 genes in this pathway |
| MEISSNER NPC HCP WITH H3K4ME2 | 491 | 319 | All SZGR 2.0 genes in this pathway |
| MIKKELSEN MEF HCP WITH H3K27ME3 | 590 | 403 | All SZGR 2.0 genes in this pathway |
| KASLER HDAC7 TARGETS 1 UP | 194 | 133 | All SZGR 2.0 genes in this pathway |
| ACEVEDO FGFR1 TARGETS IN PROSTATE CANCER MODEL UP | 289 | 184 | All SZGR 2.0 genes in this pathway |
| LIM MAMMARY LUMINAL PROGENITOR UP | 58 | 30 | All SZGR 2.0 genes in this pathway |