Gene Page: GTPBP3
Summary ?
| GeneID | 84705 |
| Symbol | GTPBP3 |
| Synonyms | COXPD23|GTPBG3|MSS1|MTGP1|THDF1 |
| Description | GTP binding protein 3 (mitochondrial) |
| Reference | MIM:608536|HGNC:HGNC:14880|Ensembl:ENSG00000130299|HPRD:12255|Vega:OTTHUMG00000182766 |
| Gene type | protein-coding |
| Map location | 19p13.11 |
| Pascal p-value | 0.924 |
| Sherlock p-value | 0.01 |
| TADA p-value | 0.002 |
| Fetal beta | 1.138 |
| DMG | 1 (# studies) |
| eGene | Myers' cis & trans |
| Support | CompositeSet |
Gene in Data Sources
| Gene set name | Method of gene set | Description | Info |
|---|---|---|---|
| CV:PGCnp | Genome-wide Association Study | GWAS | |
| DMG:vanEijk_2014 | Genome-wide DNA methylation analysis | This dataset includes 432 differentially methylated CpG sites corresponding to 391 unique transcripts between schizophrenia patients (n=260) and unaffected controls (n=250). | 1 |
| DNM:Fromer_2014 | Whole Exome Sequencing analysis | This study reported a WES study of 623 schizophrenia trios, reporting DNMs using genomic DNA. |
Section I. Genetics and epigenetics annotation
 DNM table
| Gene | Chromosome | Position | Ref | Alt | Transcript | AA change | Mutation type | Sift | CG46 | Trait | Study |
|---|---|---|---|---|---|---|---|---|---|---|---|
| GTPBP3 | chr19 | 17450270 | C | CGG | NM_001128855 NM_001195422 NM_032620 NM_133644 | . . . . | frameshift frameshift frameshift frameshift | Schizophrenia | DNM:Fromer_2014 |
 Differentially methylated gene
| Probe | Chromosome | Position | Nearest gene | P (dis) | Beta (dis) | FDR (dis) | Study |
|---|---|---|---|---|---|---|---|
| cg08145177 | 19 | 17413767 | GTPBP3 | 6.966E-4 | 3.746 | DMG:vanEijk_2014 |
 eQTL annotation
| SNP ID | Chromosome | Position | eGene | Gene Entrez ID | pvalue | qvalue | TSS distance | eQTL type |
|---|---|---|---|---|---|---|---|---|
| rs7737968 | chr5 | 134403228 | GTPBP3 | 84705 | 0.04 | trans |
Section II. Transcriptome annotation
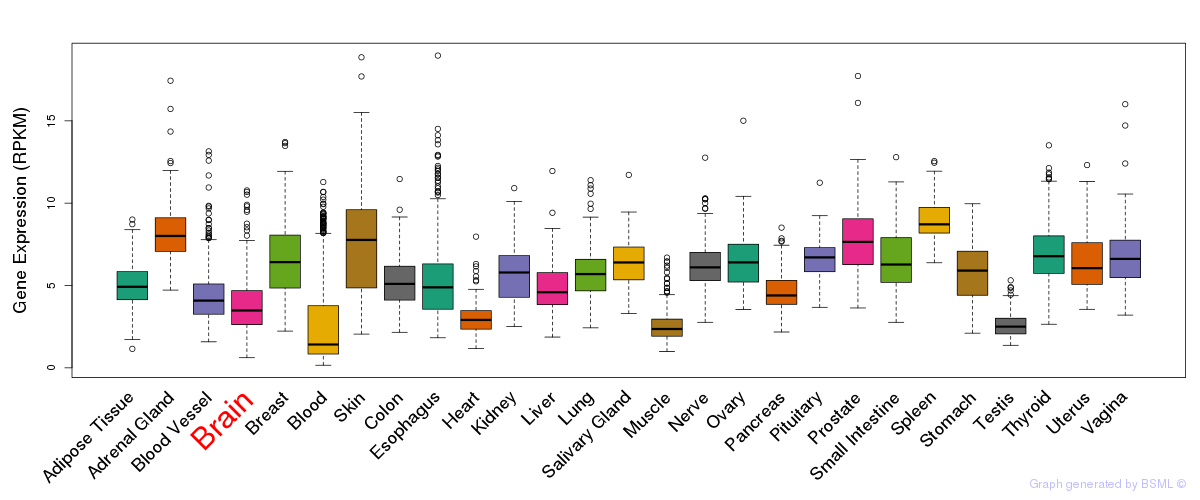
General gene expression (GTEx)

Gene expression during devlopment (BrainCloud)
Footnote:
A total of 269 time points ploted, with n=38 fetal samples (x=1:38). Each triangle represents one time point.
Gene expression of temporal and spatial changes (BrainSpan)
Footnote:
SC: sub-cortical regions; SM: sensory-motor regions; FC: frontal cortex; and TP: temporal-parietal cortex
ST1: fetal (13 - 26 postconception weeks), ST2: early infancy to late childhood (4 months to 11 years), and ST3: adolescence to adulthood (13 - 23 years)
The bar shown representes the lower 25% and upper 25% of the expression distribution.
No co-expressed genes in brain regions
Section V. Pathway annotation
| Pathway name | Pathway size | # SZGR 2.0 genes in pathway | Info |
|---|---|---|---|
| MULLIGHAN MLL SIGNATURE 1 DN | 242 | 165 | All SZGR 2.0 genes in this pathway |
| MULLIGHAN MLL SIGNATURE 2 DN | 281 | 186 | All SZGR 2.0 genes in this pathway |
| HAMAI APOPTOSIS VIA TRAIL DN | 186 | 107 | All SZGR 2.0 genes in this pathway |
| NUYTTEN EZH2 TARGETS DN | 1024 | 594 | All SZGR 2.0 genes in this pathway |
| WEI MYCN TARGETS WITH E BOX | 795 | 478 | All SZGR 2.0 genes in this pathway |
| BENPORATH NANOG TARGETS | 988 | 594 | All SZGR 2.0 genes in this pathway |
| BENPORATH OCT4 TARGETS | 290 | 172 | All SZGR 2.0 genes in this pathway |
| BENPORATH SOX2 TARGETS | 734 | 436 | All SZGR 2.0 genes in this pathway |
| BENPORATH NOS TARGETS | 179 | 105 | All SZGR 2.0 genes in this pathway |
| BLALOCK ALZHEIMERS DISEASE UP | 1691 | 1088 | All SZGR 2.0 genes in this pathway |
| CREIGHTON ENDOCRINE THERAPY RESISTANCE 1 | 528 | 324 | All SZGR 2.0 genes in this pathway |
| SANSOM APC MYC TARGETS | 217 | 138 | All SZGR 2.0 genes in this pathway |
| SANSOM APC TARGETS REQUIRE MYC | 210 | 123 | All SZGR 2.0 genes in this pathway |
| WAKABAYASHI ADIPOGENESIS PPARG RXRA BOUND 8D | 882 | 506 | All SZGR 2.0 genes in this pathway |
| FORTSCHEGGER PHF8 TARGETS DN | 784 | 464 | All SZGR 2.0 genes in this pathway |