Gene Page: TBRG1
Summary ?
| GeneID | 84897 |
| Symbol | TBRG1 |
| Synonyms | NIAM|TB-5 |
| Description | transforming growth factor beta regulator 1 |
| Reference | MIM:610614|HGNC:HGNC:29551|Ensembl:ENSG00000154144|HPRD:15477|Vega:OTTHUMG00000153024 |
| Gene type | protein-coding |
| Map location | 11q24.2 |
| Pascal p-value | 0.001 |
| Sherlock p-value | 0.033 |
| Fetal beta | -0.992 |
| eGene | Myers' cis & trans |
Gene in Data Sources
| Gene set name | Method of gene set | Description | Info |
|---|---|---|---|
| CV:PGCnp | Genome-wide Association Study | GWAS |
Section I. Genetics and epigenetics annotation
 eQTL annotation
| SNP ID | Chromosome | Position | eGene | Gene Entrez ID | pvalue | qvalue | TSS distance | eQTL type |
|---|---|---|---|---|---|---|---|---|
| rs763641 | chr11 | 123846625 | TBRG1 | 84897 | 0 | cis | ||
| rs10751722 | chr1 | 27543522 | TBRG1 | 84897 | 0.2 | trans | ||
| rs3769467 | chr2 | 201205340 | TBRG1 | 84897 | 0.03 | trans | ||
| rs3769461 | chr2 | 201222657 | TBRG1 | 84897 | 0.03 | trans | ||
| rs17007781 | chr4 | 124977313 | TBRG1 | 84897 | 0.06 | trans | ||
| rs2289256 | chr4 | 187089132 | TBRG1 | 84897 | 0.06 | trans | ||
| rs11793484 | chr9 | 317239 | TBRG1 | 84897 | 0.05 | trans | ||
| rs10970457 | chr9 | 326183 | TBRG1 | 84897 | 0.05 | trans | ||
| rs763641 | chr11 | 123846625 | TBRG1 | 84897 | 0.1 | trans | ||
| rs7933478 | chr11 | 126004782 | TBRG1 | 84897 | 0.12 | trans | ||
| rs7309022 | chr12 | 92666566 | TBRG1 | 84897 | 0.1 | trans | ||
| rs288438 | chr15 | 98161777 | TBRG1 | 84897 | 0.19 | trans | ||
| rs5998188 | chr22 | 32344841 | TBRG1 | 84897 | 0.16 | trans |
Section II. Transcriptome annotation
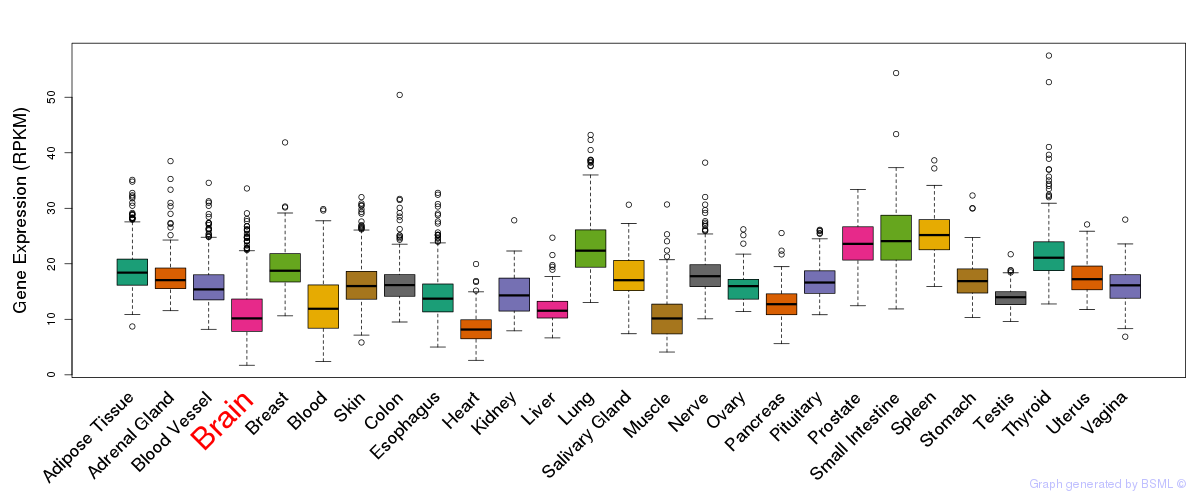
General gene expression (GTEx)
Gene expression during devlopment (BrainCloud)
Footnote:
A total of 269 time points ploted, with n=38 fetal samples (x=1:38). Each triangle represents one time point.
Gene expression of temporal and spatial changes (BrainSpan)
Footnote:
SC: sub-cortical regions; SM: sensory-motor regions; FC: frontal cortex; and TP: temporal-parietal cortex
ST1: fetal (13 - 26 postconception weeks), ST2: early infancy to late childhood (4 months to 11 years), and ST3: adolescence to adulthood (13 - 23 years)
The bar shown representes the lower 25% and upper 25% of the expression distribution.
No co-expressed genes in brain regions
Section V. Pathway annotation
| Pathway name | Pathway size | # SZGR 2.0 genes in pathway | Info |
|---|---|---|---|
| GINESTIER BREAST CANCER 20Q13 AMPLIFICATION DN | 180 | 101 | All SZGR 2.0 genes in this pathway |
| RODRIGUES THYROID CARCINOMA POORLY DIFFERENTIATED DN | 805 | 505 | All SZGR 2.0 genes in this pathway |
| LASTOWSKA NEUROBLASTOMA COPY NUMBER DN | 800 | 473 | All SZGR 2.0 genes in this pathway |
| NUYTTEN NIPP1 TARGETS UP | 769 | 437 | All SZGR 2.0 genes in this pathway |
| RAMALHO STEMNESS UP | 206 | 118 | All SZGR 2.0 genes in this pathway |
| MARSON BOUND BY FOXP3 STIMULATED | 1022 | 619 | All SZGR 2.0 genes in this pathway |
| MARSON BOUND BY FOXP3 UNSTIMULATED | 1229 | 713 | All SZGR 2.0 genes in this pathway |
| PECE MAMMARY STEM CELL DN | 146 | 88 | All SZGR 2.0 genes in this pathway |