Gene Page: LRP11
Summary ?
| GeneID | 84918 |
| Symbol | LRP11 |
| Synonyms | MANSC3|bA350J20.3 |
| Description | LDL receptor related protein 11 |
| Reference | HGNC:HGNC:16936|Ensembl:ENSG00000120256|HPRD:17446|Vega:OTTHUMG00000015801 |
| Gene type | protein-coding |
| Map location | 6q25.1 |
| Pascal p-value | 0.027 |
| Sherlock p-value | 0.713 |
| Fetal beta | -1.529 |
| DMG | 1 (# studies) |
Gene in Data Sources
| Gene set name | Method of gene set | Description | Info |
|---|---|---|---|
| CV:PGCnp | Genome-wide Association Study | GWAS | |
| DMG:Jaffe_2016 | Genome-wide DNA methylation analysis | This dataset includes 2,104 probes/CpGs associated with SZ patients (n=108) compared to 136 controls at Bonferroni-adjusted P < 0.05. | 1 |
Section I. Genetics and epigenetics annotation
 Differentially methylated gene
| Probe | Chromosome | Position | Nearest gene | P (dis) | Beta (dis) | FDR (dis) | Study |
|---|---|---|---|---|---|---|---|
| cg24761195 | 6 | 150184345 | LRP11 | 8.75E-8 | -0.009 | 2.01E-5 | DMG:Jaffe_2016 |
Section II. Transcriptome annotation
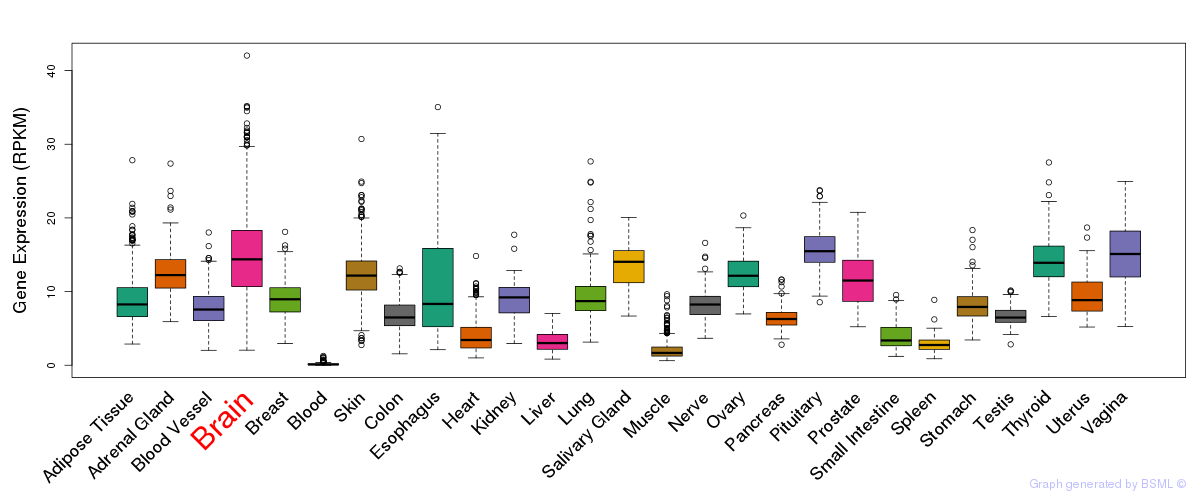
General gene expression (GTEx)

Gene expression during devlopment (BrainCloud)
Footnote:
A total of 269 time points ploted, with n=38 fetal samples (x=1:38). Each triangle represents one time point.
Gene expression of temporal and spatial changes (BrainSpan)
Footnote:
SC: sub-cortical regions; SM: sensory-motor regions; FC: frontal cortex; and TP: temporal-parietal cortex
ST1: fetal (13 - 26 postconception weeks), ST2: early infancy to late childhood (4 months to 11 years), and ST3: adolescence to adulthood (13 - 23 years)
The bar shown representes the lower 25% and upper 25% of the expression distribution.
No co-expressed genes in brain regions
Section III. Gene Ontology annotation
| Molecular function | GO term | Evidence | Neuro keywords | PubMed ID |
|---|---|---|---|---|
| GO:0004872 | receptor activity | IEA | - | |
| Cellular component | GO term | Evidence | Neuro keywords | PubMed ID |
| GO:0016020 | membrane | IEA | - | |
| GO:0016021 | integral to membrane | IEA | - |
Section V. Pathway annotation
| Pathway name | Pathway size | # SZGR 2.0 genes in pathway | Info |
|---|---|---|---|
| SENGUPTA NASOPHARYNGEAL CARCINOMA DN | 349 | 157 | All SZGR 2.0 genes in this pathway |
| SENESE HDAC1 AND HDAC2 TARGETS DN | 232 | 139 | All SZGR 2.0 genes in this pathway |
| SENESE HDAC2 TARGETS DN | 133 | 77 | All SZGR 2.0 genes in this pathway |
| DODD NASOPHARYNGEAL CARCINOMA UP | 1821 | 933 | All SZGR 2.0 genes in this pathway |
| PATIL LIVER CANCER | 747 | 453 | All SZGR 2.0 genes in this pathway |
| LIAO METASTASIS | 539 | 324 | All SZGR 2.0 genes in this pathway |
| CREIGHTON ENDOCRINE THERAPY RESISTANCE 3 | 720 | 440 | All SZGR 2.0 genes in this pathway |
| CREIGHTON ENDOCRINE THERAPY RESISTANCE 5 | 482 | 296 | All SZGR 2.0 genes in this pathway |
| LEIN NEURON MARKERS | 69 | 45 | All SZGR 2.0 genes in this pathway |
| ACEVEDO LIVER CANCER UP | 973 | 570 | All SZGR 2.0 genes in this pathway |
| TOYOTA TARGETS OF MIR34B AND MIR34C | 463 | 262 | All SZGR 2.0 genes in this pathway |
| BRUECKNER TARGETS OF MIRLET7A3 UP | 111 | 69 | All SZGR 2.0 genes in this pathway |
| CHICAS RB1 TARGETS SENESCENT | 572 | 352 | All SZGR 2.0 genes in this pathway |
| PANGAS TUMOR SUPPRESSION BY SMAD1 AND SMAD5 DN | 157 | 106 | All SZGR 2.0 genes in this pathway |
| DURAND STROMA S UP | 297 | 194 | All SZGR 2.0 genes in this pathway |
Section VI. microRNA annotation
| miRNA family | Target position | miRNA ID | miRNA seq | ||
|---|---|---|---|---|---|
| UTR start | UTR end | Match method | |||
| miR-135 | 1594 | 1600 | 1A | hsa-miR-135a | UAUGGCUUUUUAUUCCUAUGUGA |
| hsa-miR-135b | UAUGGCUUUUCAUUCCUAUGUG | ||||
| miR-543 | 981 | 987 | 1A | hsa-miR-543 | AAACAUUCGCGGUGCACUUCU |
- SZ: miRNAs which differentially expressed in brain cortex of schizophrenia patients comparing with control samples using microarray. Click here to see the list of SZ related miRNAs.
- Brain: miRNAs which are expressed in brain based on miRNA microarray expression studies. Click here to see the list of brain related miRNAs.