Gene Page: TNKS1BP1
Summary ?
| GeneID | 85456 |
| Symbol | TNKS1BP1 |
| Synonyms | TAB182 |
| Description | tankyrase 1 binding protein 1 |
| Reference | MIM:607104|HGNC:HGNC:19081|Ensembl:ENSG00000149115|HPRD:06164|Vega:OTTHUMG00000167022 |
| Gene type | protein-coding |
| Map location | 11q12.1 |
| Pascal p-value | 0.012 |
| Sherlock p-value | 0.133 |
| Fetal beta | 0.174 |
| DMG | 1 (# studies) |
| eGene | Myers' cis & trans |
Gene in Data Sources
| Gene set name | Method of gene set | Description | Info |
|---|---|---|---|
| CV:PGCnp | Genome-wide Association Study | GWAS | |
| DMG:Wockner_2014 | Genome-wide DNA methylation analysis | This dataset includes 4641 differentially methylated probes corresponding to 2929 unique genes between schizophrenia patients (n=24) and controls (n=24). | 3 |
Section I. Genetics and epigenetics annotation
 Differentially methylated gene
| Probe | Chromosome | Position | Nearest gene | P (dis) | Beta (dis) | FDR (dis) | Study |
|---|---|---|---|---|---|---|---|
| cg00489660 | 11 | 57089821 | TNKS1BP1 | 4.058E-4 | 0.292 | 0.044 | DMG:Wockner_2014 |
| cg13526040 | 11 | 57093322 | TNKS1BP1 | 4.452E-4 | 0.292 | 0.045 | DMG:Wockner_2014 |
| cg17333251 | 11 | 57091806 | TNKS1BP1 | 4.873E-4 | -0.311 | 0.047 | DMG:Wockner_2014 |
eQTL annotation
| SNP ID | Chromosome | Position | eGene | Gene Entrez ID | pvalue | qvalue | TSS distance | eQTL type |
|---|---|---|---|---|---|---|---|---|
| rs7911247 | chr10 | 49724799 | TNKS1BP1 | 85456 | 0.09 | trans |
Section II. Transcriptome annotation
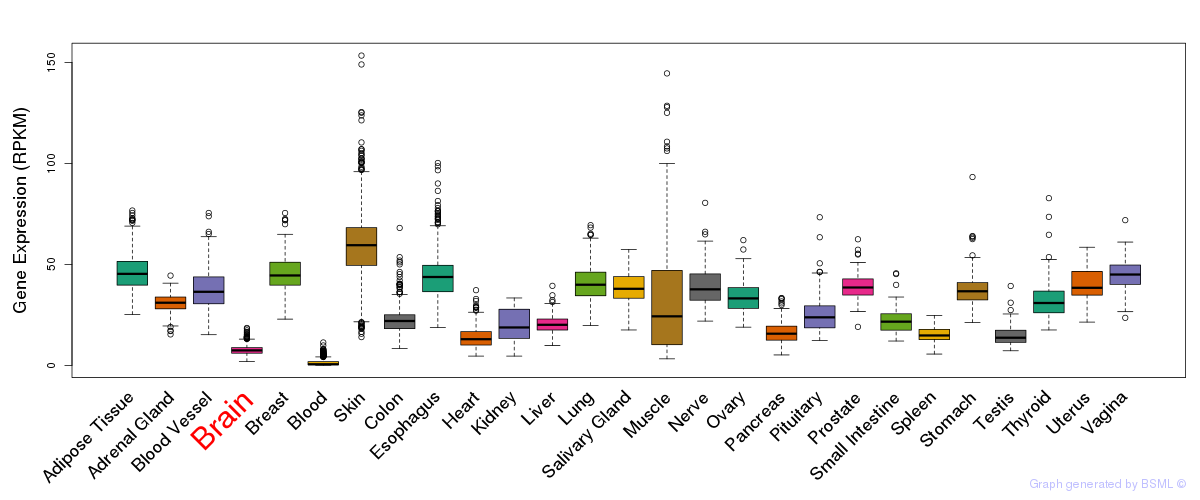
General gene expression (GTEx)
Gene expression during devlopment (BrainCloud)
Footnote:
A total of 269 time points ploted, with n=38 fetal samples (x=1:38). Each triangle represents one time point.
Gene expression of temporal and spatial changes (BrainSpan)
Footnote:
SC: sub-cortical regions; SM: sensory-motor regions; FC: frontal cortex; and TP: temporal-parietal cortex
ST1: fetal (13 - 26 postconception weeks), ST2: early infancy to late childhood (4 months to 11 years), and ST3: adolescence to adulthood (13 - 23 years)
The bar shown representes the lower 25% and upper 25% of the expression distribution.
No co-expressed genes in brain regions
Section V. Pathway annotation
| Pathway name | Pathway size | # SZGR 2.0 genes in pathway | Info |
|---|---|---|---|
| REACTOME DEADENYLATION OF MRNA | 22 | 14 | All SZGR 2.0 genes in this pathway |
| REACTOME METABOLISM OF MRNA | 284 | 128 | All SZGR 2.0 genes in this pathway |
| REACTOME DEADENYLATION DEPENDENT MRNA DECAY | 48 | 29 | All SZGR 2.0 genes in this pathway |
| REACTOME METABOLISM OF RNA | 330 | 155 | All SZGR 2.0 genes in this pathway |
| CHARAFE BREAST CANCER LUMINAL VS MESENCHYMAL UP | 450 | 256 | All SZGR 2.0 genes in this pathway |
| NUYTTEN EZH2 TARGETS UP | 1037 | 673 | All SZGR 2.0 genes in this pathway |
| MCCABE BOUND BY HOXC6 | 469 | 239 | All SZGR 2.0 genes in this pathway |
| MIKKELSEN MCV6 LCP WITH H3K4ME3 | 162 | 80 | All SZGR 2.0 genes in this pathway |
| MIKKELSEN MEF LCP WITH H3K4ME3 | 128 | 68 | All SZGR 2.0 genes in this pathway |
| MIKKELSEN IPS LCP WITH H3K4ME3 | 174 | 100 | All SZGR 2.0 genes in this pathway |
| MIKKELSEN ES LCP WITH H3K4ME3 | 142 | 80 | All SZGR 2.0 genes in this pathway |