Gene Page: PTCH2
Summary ?
| GeneID | 8643 |
| Symbol | PTCH2 |
| Synonyms | PTC2 |
| Description | patched 2 |
| Reference | MIM:603673|HGNC:HGNC:9586|Ensembl:ENSG00000117425|HPRD:04722|Vega:OTTHUMG00000008490 |
| Gene type | protein-coding |
| Map location | 1p34.1 |
| Pascal p-value | 0.234 |
| Fetal beta | 0.009 |
| DMG | 1 (# studies) |
Gene in Data Sources
| Gene set name | Method of gene set | Description | Info |
|---|---|---|---|
| CV:PGCnp | Genome-wide Association Study | GWAS | |
| DMG:Wockner_2014 | Genome-wide DNA methylation analysis | This dataset includes 4641 differentially methylated probes corresponding to 2929 unique genes between schizophrenia patients (n=24) and controls (n=24). | 1 |
Section I. Genetics and epigenetics annotation
 Differentially methylated gene
| Probe | Chromosome | Position | Nearest gene | P (dis) | Beta (dis) | FDR (dis) | Study |
|---|---|---|---|---|---|---|---|
| cg04145643 | 1 | 45288012 | PTCH2 | 2.414E-4 | 0.437 | 0.037 | DMG:Wockner_2014 |
Section II. Transcriptome annotation
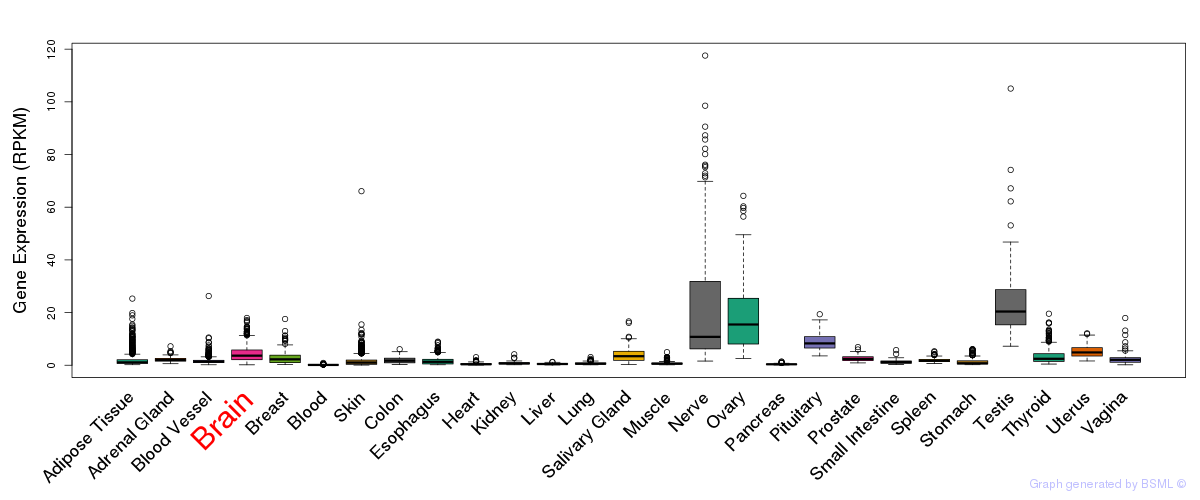
General gene expression (GTEx)
Gene expression during devlopment (BrainCloud)
Footnote:
A total of 269 time points ploted, with n=38 fetal samples (x=1:38). Each triangle represents one time point.
Gene expression of temporal and spatial changes (BrainSpan)
Footnote:
SC: sub-cortical regions; SM: sensory-motor regions; FC: frontal cortex; and TP: temporal-parietal cortex
ST1: fetal (13 - 26 postconception weeks), ST2: early infancy to late childhood (4 months to 11 years), and ST3: adolescence to adulthood (13 - 23 years)
The bar shown representes the lower 25% and upper 25% of the expression distribution.
Top co-expressed genes in brain regions
| Top 10 positively co-expressed genes | ||
| Gene | Pearson's Correlation | Spearman's Correlation |
| ABHD12B | 0.67 | 0.68 |
| CORO6 | 0.65 | 0.73 |
| PTHLH | 0.63 | 0.63 |
| RAB37 | 0.63 | 0.67 |
| CHRNB3 | 0.63 | 0.62 |
| STBD1 | 0.61 | 0.58 |
| EPS8L2 | 0.61 | 0.57 |
| LPCAT4 | 0.61 | 0.61 |
| ALKBH6 | 0.60 | 0.64 |
| CPNE9 | 0.60 | 0.69 |
| Top 10 negatively co-expressed genes | ||
| Gene | Pearson's Correlation | Spearman's Correlation |
| TUBB2B | -0.43 | -0.53 |
| KIAA1949 | -0.42 | -0.46 |
| YBX1 | -0.42 | -0.51 |
| PPP1R14B | -0.42 | -0.56 |
| CARHSP1 | -0.41 | -0.58 |
| AC079354.7 | -0.41 | -0.52 |
| CD24 | -0.41 | -0.40 |
| ZNF501 | -0.41 | -0.49 |
| TIGD1 | -0.41 | -0.46 |
| MARCKSL1 | -0.41 | -0.45 |
Section V. Pathway annotation
| Pathway name | Pathway size | # SZGR 2.0 genes in pathway | Info |
|---|---|---|---|
| KEGG HEDGEHOG SIGNALING PATHWAY | 56 | 42 | All SZGR 2.0 genes in this pathway |
| KEGG PATHWAYS IN CANCER | 328 | 259 | All SZGR 2.0 genes in this pathway |
| KEGG BASAL CELL CARCINOMA | 55 | 44 | All SZGR 2.0 genes in this pathway |
| PID HEDGEHOG 2PATHWAY | 22 | 17 | All SZGR 2.0 genes in this pathway |
| REACTOME SIGNALING BY GPCR | 920 | 449 | All SZGR 2.0 genes in this pathway |
| REACTOME CLASS B 2 SECRETIN FAMILY RECEPTORS | 88 | 58 | All SZGR 2.0 genes in this pathway |
| REACTOME GPCR LIGAND BINDING | 408 | 246 | All SZGR 2.0 genes in this pathway |
| ODONNELL METASTASIS UP | 82 | 58 | All SZGR 2.0 genes in this pathway |
| MOHANKUMAR TLX1 TARGETS DN | 193 | 112 | All SZGR 2.0 genes in this pathway |
| SHIN B CELL LYMPHOMA CLUSTER 1 | 13 | 11 | All SZGR 2.0 genes in this pathway |
| LEE TARGETS OF PTCH1 AND SUFU UP | 53 | 37 | All SZGR 2.0 genes in this pathway |
| MEISSNER BRAIN HCP WITH H3K4ME3 AND H3K27ME3 | 1069 | 729 | All SZGR 2.0 genes in this pathway |
| PEDRIOLI MIR31 TARGETS UP | 221 | 120 | All SZGR 2.0 genes in this pathway |
| RAO BOUND BY SALL4 ISOFORM B | 517 | 302 | All SZGR 2.0 genes in this pathway |
| ZWANG EGF INTERVAL UP | 105 | 46 | All SZGR 2.0 genes in this pathway |