Gene Page: NOL4
Summary ?
| GeneID | 8715 |
| Symbol | NOL4 |
| Synonyms | CT125|HRIHFB2255|NOLP |
| Description | nucleolar protein 4 |
| Reference | MIM:603577|HGNC:HGNC:7870|Ensembl:ENSG00000101746|HPRD:04657|Vega:OTTHUMG00000132291 |
| Gene type | protein-coding |
| Map location | 18q12 |
| Pascal p-value | 2.661E-5 |
| Sherlock p-value | 0.559 |
| Fetal beta | 1.218 |
| DMG | 1 (# studies) |
| eGene | Myers' cis & trans |
Gene in Data Sources
| Gene set name | Method of gene set | Description | Info |
|---|---|---|---|
| CV:PGCnp | Genome-wide Association Study | GWAS | |
| DMG:Jaffe_2016 | Genome-wide DNA methylation analysis | This dataset includes 2,104 probes/CpGs associated with SZ patients (n=108) compared to 136 controls at Bonferroni-adjusted P < 0.05. | 2 |
Section I. Genetics and epigenetics annotation
 Differentially methylated gene
| Probe | Chromosome | Position | Nearest gene | P (dis) | Beta (dis) | FDR (dis) | Study |
|---|---|---|---|---|---|---|---|
| cg12911428 | 18 | 31804742 | NOL4 | 1.06E-10 | -0.011 | 4.65E-7 | DMG:Jaffe_2016 |
| cg21016956 | 18 | 31802419 | NOL4 | 2E-8 | -0.018 | 6.95E-6 | DMG:Jaffe_2016 |
eQTL annotation
| SNP ID | Chromosome | Position | eGene | Gene Entrez ID | pvalue | qvalue | TSS distance | eQTL type |
|---|---|---|---|---|---|---|---|---|
| rs6586487 | chr1 | 18339747 | NOL4 | 8715 | 0.1 | trans | ||
| rs17472583 | chr1 | 18340024 | NOL4 | 8715 | 0.18 | trans | ||
| rs17432613 | chr1 | 18346091 | NOL4 | 8715 | 0.12 | trans | ||
| rs6902183 | chr6 | 121963786 | NOL4 | 8715 | 0.14 | trans |
Section II. Transcriptome annotation
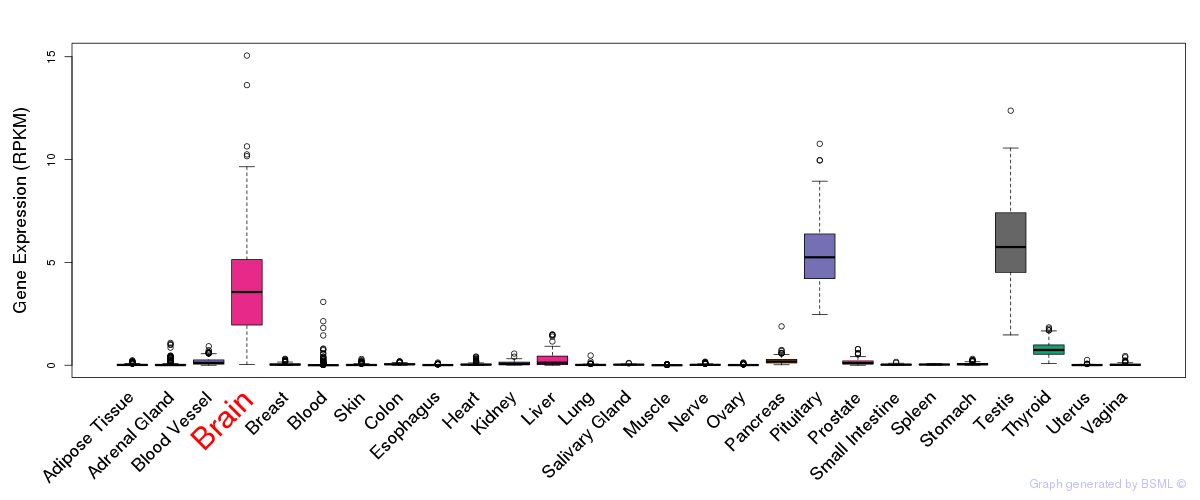
General gene expression (GTEx)
Gene expression during devlopment (BrainCloud)
Footnote:
A total of 269 time points ploted, with n=38 fetal samples (x=1:38). Each triangle represents one time point.
Gene expression of temporal and spatial changes (BrainSpan)
Footnote:
SC: sub-cortical regions; SM: sensory-motor regions; FC: frontal cortex; and TP: temporal-parietal cortex
ST1: fetal (13 - 26 postconception weeks), ST2: early infancy to late childhood (4 months to 11 years), and ST3: adolescence to adulthood (13 - 23 years)
The bar shown representes the lower 25% and upper 25% of the expression distribution.
Top co-expressed genes in brain regions
| Top 10 positively co-expressed genes | ||
| Gene | Pearson's Correlation | Spearman's Correlation |
| SIDT1 | 0.85 | 0.76 |
| RASSF5 | 0.84 | 0.73 |
| KCNC2 | 0.84 | 0.74 |
| TRPM2 | 0.83 | 0.77 |
| PPM1H | 0.83 | 0.75 |
| NDRG4 | 0.82 | 0.75 |
| OLFM3 | 0.81 | 0.71 |
| STS | 0.81 | 0.69 |
| CIT | 0.81 | 0.67 |
| GPR123 | 0.81 | 0.69 |
| Top 10 negatively co-expressed genes | ||
| Gene | Pearson's Correlation | Spearman's Correlation |
| BCL7C | -0.45 | -0.59 |
| C9orf46 | -0.42 | -0.52 |
| FAM36A | -0.41 | -0.45 |
| GTF3C6 | -0.41 | -0.49 |
| AC006276.2 | -0.40 | -0.45 |
| RPL23A | -0.40 | -0.51 |
| EXOSC8 | -0.40 | -0.45 |
| DYNLT1 | -0.40 | -0.55 |
| AC135586.1 | -0.39 | -0.46 |
| RPLP1 | -0.39 | -0.46 |
Section V. Pathway annotation
| Pathway name | Pathway size | # SZGR 2.0 genes in pathway | Info |
|---|---|---|---|
| MARTORIATI MDM4 TARGETS NEUROEPITHELIUM DN | 164 | 111 | All SZGR 2.0 genes in this pathway |
| BENPORATH SUZ12 TARGETS | 1038 | 678 | All SZGR 2.0 genes in this pathway |
| BENPORATH EED TARGETS | 1062 | 725 | All SZGR 2.0 genes in this pathway |
| BENPORATH ES WITH H3K27ME3 | 1118 | 744 | All SZGR 2.0 genes in this pathway |
| BENPORATH PRC2 TARGETS | 652 | 441 | All SZGR 2.0 genes in this pathway |
| DOUGLAS BMI1 TARGETS DN | 314 | 188 | All SZGR 2.0 genes in this pathway |
| KONDO PROSTATE CANCER HCP WITH H3K27ME3 | 97 | 72 | All SZGR 2.0 genes in this pathway |
| MIKKELSEN MEF ICP WITH H3K4ME3 AND H3K27ME3 | 38 | 34 | All SZGR 2.0 genes in this pathway |
| MIKKELSEN IPS ICP WITH H3K27ME3 | 54 | 32 | All SZGR 2.0 genes in this pathway |
| MIKKELSEN ES ICP WITH H3K4ME3 AND H3K27ME3 | 137 | 85 | All SZGR 2.0 genes in this pathway |
| MIKKELSEN NPC ICP WITH H3K4ME3 | 445 | 257 | All SZGR 2.0 genes in this pathway |
| BROWNE HCMV INFECTION 4HR DN | 254 | 158 | All SZGR 2.0 genes in this pathway |
| VERHAAK GLIOBLASTOMA PRONEURAL | 177 | 132 | All SZGR 2.0 genes in this pathway |