Gene Page: MBTPS1
Summary ?
| GeneID | 8720 |
| Symbol | MBTPS1 |
| Synonyms | PCSK8|S1P|SKI-1 |
| Description | membrane bound transcription factor peptidase, site 1 |
| Reference | MIM:603355|HGNC:HGNC:15456|Ensembl:ENSG00000140943|HPRD:04522|Vega:OTTHUMG00000137639 |
| Gene type | protein-coding |
| Map location | 16q24 |
| Pascal p-value | 0.07 |
| Sherlock p-value | 0.716 |
| TADA p-value | 0.018 |
| Fetal beta | 0.651 |
| Support | CompositeSet Ascano FMRP targets |
Gene in Data Sources
| Gene set name | Method of gene set | Description | Info |
|---|---|---|---|
| CV:PGCnp | Genome-wide Association Study | GWAS | |
| DNM:Xu_2012 | Whole Exome Sequencing analysis | De novo mutations of 4 genes were identified by exome sequencing of 795 samples in this study | |
| GO_Annotation | Mapping neuro-related keywords to Gene Ontology annotations | Hits with neuro-related keywords: 1 |
Section I. Genetics and epigenetics annotation
 DNM table
| Gene | Chromosome | Position | Ref | Alt | Transcript | AA change | Mutation type | Sift | CG46 | Trait | Study |
|---|---|---|---|---|---|---|---|---|---|---|---|
| MBTPS1 | chr16 | 84104320 | G | A | NM_003791 | p.552S>F | missense | Schizophrenia | DNM:Xu_2012 |
Section II. Transcriptome annotation
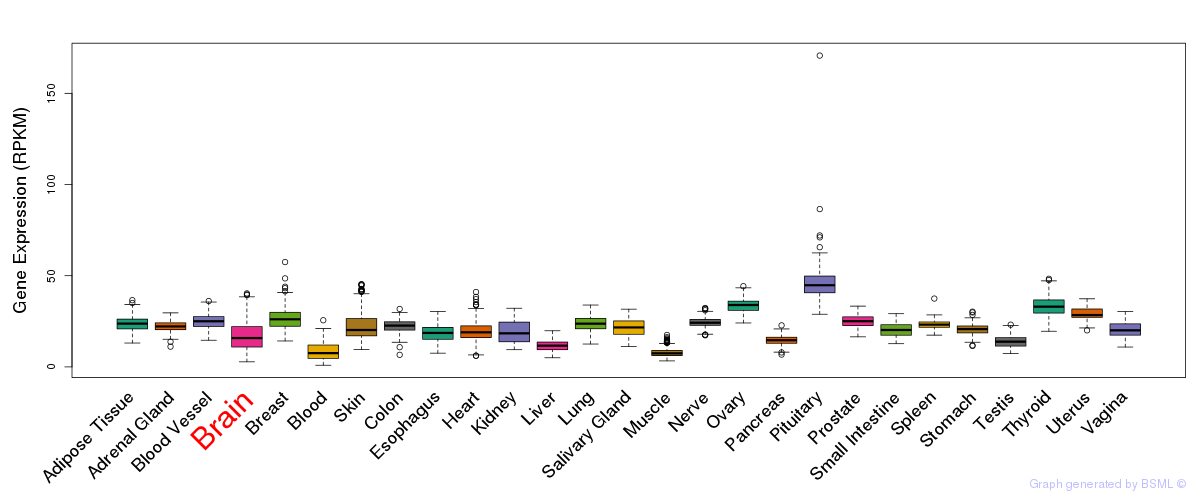
General gene expression (GTEx)
Gene expression during devlopment (BrainCloud)
Footnote:
A total of 269 time points ploted, with n=38 fetal samples (x=1:38). Each triangle represents one time point.
Gene expression of temporal and spatial changes (BrainSpan)
Footnote:
SC: sub-cortical regions; SM: sensory-motor regions; FC: frontal cortex; and TP: temporal-parietal cortex
ST1: fetal (13 - 26 postconception weeks), ST2: early infancy to late childhood (4 months to 11 years), and ST3: adolescence to adulthood (13 - 23 years)
The bar shown representes the lower 25% and upper 25% of the expression distribution.
Top co-expressed genes in brain regions
| Top 10 positively co-expressed genes | ||
| Gene | Pearson's Correlation | Spearman's Correlation |
| SDPR | 0.61 | 0.64 |
| FGR | 0.61 | 0.57 |
| GATA2 | 0.59 | 0.57 |
| CXorf36 | 0.57 | 0.60 |
| C1QTNF1 | 0.57 | 0.53 |
| HLA-E | 0.57 | 0.57 |
| FAM38A | 0.57 | 0.57 |
| TGM2 | 0.57 | 0.58 |
| MMRN2 | 0.57 | 0.57 |
| ERG | 0.56 | 0.57 |
| Top 10 negatively co-expressed genes | ||
| Gene | Pearson's Correlation | Spearman's Correlation |
| TCTEX1D2 | -0.42 | -0.46 |
| MED19 | -0.42 | -0.43 |
| COQ3 | -0.41 | -0.42 |
| UCHL3 | -0.41 | -0.42 |
| FRG1 | -0.40 | -0.45 |
| OCIAD2 | -0.40 | -0.43 |
| C18orf21 | -0.40 | -0.43 |
| PSMB7 | -0.40 | -0.42 |
| ZNF613 | -0.40 | -0.41 |
| C12orf45 | -0.39 | -0.44 |
Section III. Gene Ontology annotation
| Molecular function | GO term | Evidence | Neuro keywords | PubMed ID |
|---|---|---|---|---|
| GO:0004252 | serine-type endopeptidase activity | TAS | glutamate (GO term level: 7) | 9809072 |
| GO:0005509 | calcium ion binding | IEA | - | |
| GO:0008233 | peptidase activity | IEA | - | |
| Biological process | GO term | Evidence | Neuro keywords | PubMed ID |
| GO:0006508 | proteolysis | TAS | 9809072 | |
| GO:0008202 | steroid metabolic process | IEA | - | |
| GO:0008203 | cholesterol metabolic process | IEA | - | |
| GO:0006629 | lipid metabolic process | IEA | - | |
| Cellular component | GO term | Evidence | Neuro keywords | PubMed ID |
| GO:0000139 | Golgi membrane | IEA | - | |
| GO:0005794 | Golgi apparatus | IEA | - | |
| GO:0005788 | endoplasmic reticulum lumen | TAS | 9809072 | |
| GO:0005789 | endoplasmic reticulum membrane | IEA | - | |
| GO:0005634 | nucleus | IDA | 18029348 | |
| GO:0005737 | cytoplasm | IDA | 18029348 | |
| GO:0005783 | endoplasmic reticulum | IEA | - | |
| GO:0016020 | membrane | IEA | - | |
| GO:0016021 | integral to membrane | IEA | - |
Section V. Pathway annotation
| Pathway name | Pathway size | # SZGR 2.0 genes in pathway | Info |
|---|---|---|---|
| REACTOME DIABETES PATHWAYS | 133 | 91 | All SZGR 2.0 genes in this pathway |
| REACTOME ACTIVATION OF CHAPERONES BY ATF6 ALPHA | 13 | 9 | All SZGR 2.0 genes in this pathway |
| REACTOME UNFOLDED PROTEIN RESPONSE | 80 | 51 | All SZGR 2.0 genes in this pathway |
| ONKEN UVEAL MELANOMA DN | 526 | 357 | All SZGR 2.0 genes in this pathway |
| ENK UV RESPONSE EPIDERMIS DN | 508 | 354 | All SZGR 2.0 genes in this pathway |
| GRAESSMANN APOPTOSIS BY DOXORUBICIN DN | 1781 | 1082 | All SZGR 2.0 genes in this pathway |
| OUELLET OVARIAN CANCER INVASIVE VS LMP UP | 117 | 85 | All SZGR 2.0 genes in this pathway |
| MCBRYAN PUBERTAL BREAST 4 5WK DN | 196 | 131 | All SZGR 2.0 genes in this pathway |
| MCBRYAN PUBERTAL BREAST 5 6WK DN | 137 | 97 | All SZGR 2.0 genes in this pathway |
| MCBRYAN PUBERTAL BREAST 6 7WK UP | 197 | 135 | All SZGR 2.0 genes in this pathway |
| MCBRYAN PUBERTAL TGFB1 TARGETS DN | 62 | 44 | All SZGR 2.0 genes in this pathway |
| AIYAR COBRA1 TARGETS UP | 39 | 25 | All SZGR 2.0 genes in this pathway |
| NUYTTEN EZH2 TARGETS DN | 1024 | 594 | All SZGR 2.0 genes in this pathway |
| LOPEZ MBD TARGETS | 957 | 597 | All SZGR 2.0 genes in this pathway |
| KAYO CALORIE RESTRICTION MUSCLE DN | 87 | 59 | All SZGR 2.0 genes in this pathway |
| DEBIASI APOPTOSIS BY REOVIRUS INFECTION DN | 287 | 208 | All SZGR 2.0 genes in this pathway |
| RIZKI TUMOR INVASIVENESS 3D DN | 270 | 181 | All SZGR 2.0 genes in this pathway |
| MITSIADES RESPONSE TO APLIDIN UP | 439 | 257 | All SZGR 2.0 genes in this pathway |
| GRATIAS RETINOBLASTOMA 16Q24 | 17 | 15 | All SZGR 2.0 genes in this pathway |
| ZHANG TLX TARGETS 36HR UP | 221 | 150 | All SZGR 2.0 genes in this pathway |
| KIM ALL DISORDERS CALB1 CORR UP | 548 | 370 | All SZGR 2.0 genes in this pathway |