Gene Page: TNFRSF11A
Summary ?
| GeneID | 8792 |
| Symbol | TNFRSF11A |
| Synonyms | CD265|FEO|LOH18CR1|ODFR|OFE|OPTB7|OSTS|PDB2|RANK|TRANCER |
| Description | tumor necrosis factor receptor superfamily member 11a |
| Reference | MIM:603499|HGNC:HGNC:11908|Ensembl:ENSG00000141655|HPRD:04609|Vega:OTTHUMG00000132779 |
| Gene type | protein-coding |
| Map location | 18q22.1 |
| Pascal p-value | 0.279 |
| Fetal beta | -0.781 |
| DMG | 1 (# studies) |
| Support | Ascano FMRP targets |
Gene in Data Sources
| Gene set name | Method of gene set | Description | Info |
|---|---|---|---|
| CV:GWAScat | Genome-wide Association Studies | This data set includes 560 SNPs associated with schizophrenia. A total of 486 genes were mapped to these SNPs within 50kb. | |
| CV:PGCnp | Genome-wide Association Study | GWAS | |
| DMG:Wockner_2014 | Genome-wide DNA methylation analysis | This dataset includes 4641 differentially methylated probes corresponding to 2929 unique genes between schizophrenia patients (n=24) and controls (n=24). | 1 |
Section I. Genetics and epigenetics annotation
 Differentially methylated gene
| Probe | Chromosome | Position | Nearest gene | P (dis) | Beta (dis) | FDR (dis) | Study |
|---|---|---|---|---|---|---|---|
| cg17804850 | 18 | 60052386 | TNFRSF11A | 2.516E-4 | 0.528 | 0.037 | DMG:Wockner_2014 |
Section II. Transcriptome annotation
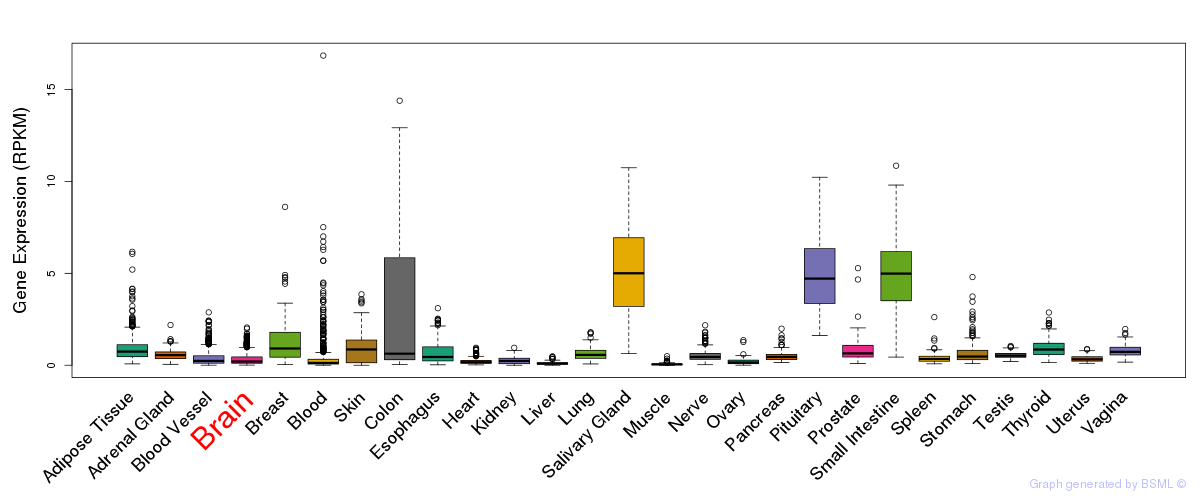
General gene expression (GTEx)
Gene expression during devlopment (BrainCloud)
Footnote:
A total of 269 time points ploted, with n=38 fetal samples (x=1:38). Each triangle represents one time point.
Gene expression of temporal and spatial changes (BrainSpan)
Footnote:
SC: sub-cortical regions; SM: sensory-motor regions; FC: frontal cortex; and TP: temporal-parietal cortex
ST1: fetal (13 - 26 postconception weeks), ST2: early infancy to late childhood (4 months to 11 years), and ST3: adolescence to adulthood (13 - 23 years)
The bar shown representes the lower 25% and upper 25% of the expression distribution.
Top co-expressed genes in brain regions
| Top 10 positively co-expressed genes | ||
| Gene | Pearson's Correlation | Spearman's Correlation |
| ENDOD1 | 0.93 | 0.80 |
| SEC14L5 | 0.92 | 0.76 |
| SLC12A2 | 0.92 | 0.82 |
| GLDN | 0.91 | 0.77 |
| PRUNE2 | 0.90 | 0.79 |
| PXK | 0.90 | 0.74 |
| PLD1 | 0.90 | 0.77 |
| PIP5K2A | 0.89 | 0.87 |
| ERMP1 | 0.89 | 0.73 |
| MAP7 | 0.89 | 0.79 |
| Top 10 negatively co-expressed genes | ||
| Gene | Pearson's Correlation | Spearman's Correlation |
| AC006276.2 | -0.53 | -0.62 |
| C9orf46 | -0.52 | -0.66 |
| BCL7C | -0.52 | -0.65 |
| RPL35 | -0.52 | -0.73 |
| RPL12 | -0.51 | -0.66 |
| RPL36 | -0.50 | -0.71 |
| RPLP1 | -0.49 | -0.65 |
| RPL27 | -0.48 | -0.67 |
| RPS9 | -0.48 | -0.66 |
| TBC1D10A | -0.48 | -0.41 |
Section V. Pathway annotation
| Pathway name | Pathway size | # SZGR 2.0 genes in pathway | Info |
|---|---|---|---|
| KEGG CYTOKINE CYTOKINE RECEPTOR INTERACTION | 267 | 161 | All SZGR 2.0 genes in this pathway |
| BIOCARTA RANKL PATHWAY | 14 | 13 | All SZGR 2.0 genes in this pathway |
| SENGUPTA NASOPHARYNGEAL CARCINOMA WITH LMP1 UP | 408 | 247 | All SZGR 2.0 genes in this pathway |
| FULCHER INFLAMMATORY RESPONSE LECTIN VS LPS UP | 579 | 346 | All SZGR 2.0 genes in this pathway |
| HORIUCHI WTAP TARGETS UP | 306 | 188 | All SZGR 2.0 genes in this pathway |
| BASAKI YBX1 TARGETS DN | 384 | 230 | All SZGR 2.0 genes in this pathway |
| RODRIGUES THYROID CARCINOMA POORLY DIFFERENTIATED DN | 805 | 505 | All SZGR 2.0 genes in this pathway |
| RODRIGUES THYROID CARCINOMA ANAPLASTIC DN | 537 | 339 | All SZGR 2.0 genes in this pathway |
| LINDGREN BLADDER CANCER CLUSTER 1 DN | 378 | 231 | All SZGR 2.0 genes in this pathway |
| BENPORATH SUZ12 TARGETS | 1038 | 678 | All SZGR 2.0 genes in this pathway |
| BENPORATH EED TARGETS | 1062 | 725 | All SZGR 2.0 genes in this pathway |
| LU IL4 SIGNALING | 94 | 56 | All SZGR 2.0 genes in this pathway |
| XU GH1 EXOGENOUS TARGETS UP | 85 | 50 | All SZGR 2.0 genes in this pathway |
| HELLER SILENCED BY METHYLATION UP | 282 | 183 | All SZGR 2.0 genes in this pathway |
| MARZEC IL2 SIGNALING DN | 36 | 24 | All SZGR 2.0 genes in this pathway |
| LINDSTEDT DENDRITIC CELL MATURATION C | 69 | 49 | All SZGR 2.0 genes in this pathway |
| CAIRO LIVER DEVELOPMENT DN | 222 | 141 | All SZGR 2.0 genes in this pathway |
| MIKKELSEN NPC HCP WITH H3K27ME3 | 341 | 243 | All SZGR 2.0 genes in this pathway |
| VERHAAK GLIOBLASTOMA MESENCHYMAL | 216 | 130 | All SZGR 2.0 genes in this pathway |
| PURBEY TARGETS OF CTBP1 NOT SATB1 UP | 344 | 215 | All SZGR 2.0 genes in this pathway |
| ZWANG TRANSIENTLY UP BY 2ND EGF PULSE ONLY | 1725 | 838 | All SZGR 2.0 genes in this pathway |