Gene Page: SYNGAP1
Summary ?
| GeneID | 8831 |
| Symbol | SYNGAP1 |
| Synonyms | MRD5|RASA1|RASA5|SYNGAP |
| Description | synaptic Ras GTPase activating protein 1 |
| Reference | MIM:603384|HGNC:HGNC:11497|Ensembl:ENSG00000197283|HPRD:16018|Vega:OTTHUMG00000031096 |
| Gene type | protein-coding |
| Map location | 6p21.3 |
| Pascal p-value | 2.236E-9 |
| TADA p-value | 0.004 |
| Fetal beta | -0.298 |
| DMG | 1 (# studies) |
| Support | G2Cdb.human_BAYES-COLLINS-HUMAN-PSD-CONSENSUS G2Cdb.human_BAYES-COLLINS-HUMAN-PSD-FULL G2Cdb.human_BAYES-COLLINS-MOUSE-PSD-CONSENSUS G2Cdb.human_clathrin G2Cdb.human_PocklingtonH1 G2Cdb.human_Synaptosome G2Cdb.human_TAP-PSD-95-CORE G2Cdb.humanNRC G2Cdb.humanPSD G2Cdb.humanPSP CompositeSet Darnell FMRP targets Potential synaptic genes |
Gene in Data Sources
| Gene set name | Method of gene set | Description | Info |
|---|---|---|---|
| CV:GWASdb | Genome-wide Association Studies | GWASdb records for schizophrenia | |
| CV:PGCnp | Genome-wide Association Study | GWAS | |
| DMG:Wockner_2014 | Genome-wide DNA methylation analysis | This dataset includes 4641 differentially methylated probes corresponding to 2929 unique genes between schizophrenia patients (n=24) and controls (n=24). | 1 |
| DNM:Xu_2012 | Whole Exome Sequencing analysis | De novo mutations of 4 genes were identified by exome sequencing of 795 samples in this study | |
| PMID:cooccur | High-throughput literature-search | Systematic search in PubMed for genes co-occurring with SCZ keywords. A total of 3027 genes were included. | |
| GSMA_I | Genome scan meta-analysis | Psr: 0.033 | |
| Literature | High-throughput literature-search | Co-occurance with Schizophrenia keywords: schizophrenia,schizophrenias | Click to show details |
Section I. Genetics and epigenetics annotation
 DNM table
| Gene | Chromosome | Position | Ref | Alt | Transcript | AA change | Mutation type | Sift | CG46 | Trait | Study |
|---|---|---|---|---|---|---|---|---|---|---|---|
| SYNGAP1 | chr6 | 33414351 | G | N | NM_006772 NM_006772 | . . | intronic splice-acceptor-in2 | Schizophrenia | DNM:Xu_2012 |
Differentially methylated gene
| Probe | Chromosome | Position | Nearest gene | P (dis) | Beta (dis) | FDR (dis) | Study |
|---|---|---|---|---|---|---|---|
| cg03200136 | 6 | 33405517 | SYNGAP1 | 4.77E-5 | 0.455 | 0.021 | DMG:Wockner_2014 |
Section II. Transcriptome annotation
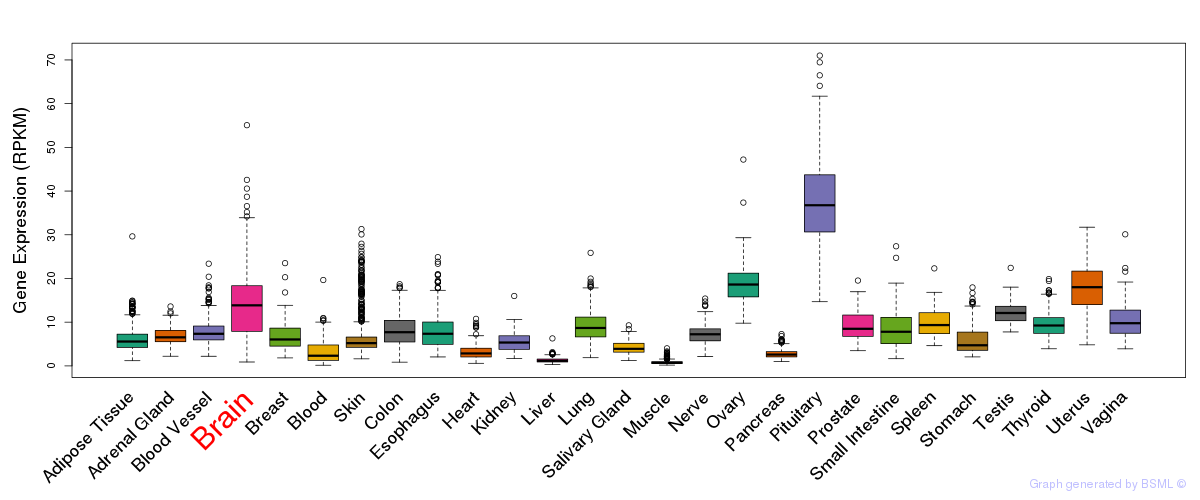
General gene expression (GTEx)
Gene expression during devlopment (BrainCloud)
Footnote:
A total of 269 time points ploted, with n=38 fetal samples (x=1:38). Each triangle represents one time point.
Gene expression of temporal and spatial changes (BrainSpan)
Footnote:
SC: sub-cortical regions; SM: sensory-motor regions; FC: frontal cortex; and TP: temporal-parietal cortex
ST1: fetal (13 - 26 postconception weeks), ST2: early infancy to late childhood (4 months to 11 years), and ST3: adolescence to adulthood (13 - 23 years)
The bar shown representes the lower 25% and upper 25% of the expression distribution.
Top co-expressed genes in brain regions
| Top 10 positively co-expressed genes | ||
| Gene | Pearson's Correlation | Spearman's Correlation |
| GATM | 0.83 | 0.80 |
| RFTN2 | 0.81 | 0.81 |
| GPM6B | 0.79 | 0.79 |
| ANXA5 | 0.79 | 0.77 |
| IRF2 | 0.79 | 0.79 |
| TOR1AIP1 | 0.78 | 0.77 |
| SLC9A9 | 0.77 | 0.77 |
| SDC2 | 0.76 | 0.74 |
| SNX5 | 0.76 | 0.77 |
| ADD3 | 0.76 | 0.77 |
| Top 10 negatively co-expressed genes | ||
| Gene | Pearson's Correlation | Spearman's Correlation |
| NEUROD2 | -0.41 | -0.28 |
| TMEM108 | -0.41 | -0.25 |
| BACH2 | -0.41 | -0.19 |
| DACT1 | -0.41 | -0.20 |
| SCUBE1 | -0.40 | -0.36 |
| ISLR2 | -0.40 | -0.21 |
| DAB1 | -0.40 | -0.17 |
| NAV2 | -0.39 | -0.21 |
| SH2D2A | -0.39 | -0.42 |
| TP53I11 | -0.39 | -0.25 |
Section III. Gene Ontology annotation
| Molecular function | GO term | Evidence | Neuro keywords | PubMed ID |
|---|---|---|---|---|
| GO:0005096 | GTPase activator activity | IEA | - | |
| GO:0017124 | SH3 domain binding | IEA | - | |
| Biological process | GO term | Evidence | Neuro keywords | PubMed ID |
| GO:0007165 | signal transduction | IEA | - | |
| GO:0051056 | regulation of small GTPase mediated signal transduction | IEA | - | |
| Cellular component | GO term | Evidence | Neuro keywords | PubMed ID |
| GO:0005622 | intracellular | IEA | - |
Section V. Pathway annotation
| Pathway name | Pathway size | # SZGR 2.0 genes in pathway | Info |
|---|---|---|---|
| PID RAS PATHWAY | 30 | 22 | All SZGR 2.0 genes in this pathway |
| YOSHIMURA MAPK8 TARGETS UP | 1305 | 895 | All SZGR 2.0 genes in this pathway |
| ZWANG TRANSIENTLY UP BY 2ND EGF PULSE ONLY | 1725 | 838 | All SZGR 2.0 genes in this pathway |
Section VI. microRNA annotation
| miRNA family | Target position | miRNA ID | miRNA seq | ||
|---|---|---|---|---|---|
| UTR start | UTR end | Match method | |||
| miR-101 | 1483 | 1490 | 1A,m8 | hsa-miR-101 | UACAGUACUGUGAUAACUGAAG |
| miR-135 | 919 | 925 | m8 | hsa-miR-135a | UAUGGCUUUUUAUUCCUAUGUGA |
| hsa-miR-135b | UAUGGCUUUUCAUUCCUAUGUG | ||||
| miR-144 | 1484 | 1490 | 1A | hsa-miR-144 | UACAGUAUAGAUGAUGUACUAG |
| miR-185 | 929 | 935 | m8 | hsa-miR-185brain | UGGAGAGAAAGGCAGUUC |
| miR-210 | 543 | 550 | 1A,m8 | hsa-miR-210 | CUGUGCGUGUGACAGCGGCUGA |
| miR-219 | 417 | 423 | m8 | hsa-miR-219brain | UGAUUGUCCAAACGCAAUUCU |
| miR-23 | 1378 | 1384 | 1A | hsa-miR-23abrain | AUCACAUUGCCAGGGAUUUCC |
| hsa-miR-23bbrain | AUCACAUUGCCAGGGAUUACC | ||||
| miR-29 | 288 | 294 | 1A | hsa-miR-29aSZ | UAGCACCAUCUGAAAUCGGUU |
| hsa-miR-29bSZ | UAGCACCAUUUGAAAUCAGUGUU | ||||
| hsa-miR-29cSZ | UAGCACCAUUUGAAAUCGGU | ||||
| miR-326 | 702 | 708 | m8 | hsa-miR-326 | CCUCUGGGCCCUUCCUCCAG |
| miR-328 | 1344 | 1350 | 1A | hsa-miR-328brain | CUGGCCCUCUCUGCCCUUCCGU |
| miR-339 | 1014 | 1020 | m8 | hsa-miR-339 | UCCCUGUCCUCCAGGAGCUCA |
| miR-384 | 912 | 919 | 1A,m8 | hsa-miR-384 | AUUCCUAGAAAUUGUUCAUA |
| miR-409-5p | 405 | 411 | 1A | hsa-miR-409-5p | AGGUUACCCGAGCAACUUUGCA |
| miR-410 | 1359 | 1365 | 1A | hsa-miR-410 | AAUAUAACACAGAUGGCCUGU |
| miR-488 | 1471 | 1477 | m8 | hsa-miR-488 | CCCAGAUAAUGGCACUCUCAA |
| miR-491 | 587 | 593 | m8 | hsa-miR-491brain | AGUGGGGAACCCUUCCAUGAGGA |
| miR-539 | 513 | 520 | 1A,m8 | hsa-miR-539 | GGAGAAAUUAUCCUUGGUGUGU |
- SZ: miRNAs which differentially expressed in brain cortex of schizophrenia patients comparing with control samples using microarray. Click here to see the list of SZ related miRNAs.
- Brain: miRNAs which are expressed in brain based on miRNA microarray expression studies. Click here to see the list of brain related miRNAs.