Gene Page: TMEM11
Summary ?
| GeneID | 8834 |
| Symbol | TMEM11 |
| Synonyms | C17orf35|PM1|PMI |
| Description | transmembrane protein 11 |
| Reference | HGNC:HGNC:16823|HPRD:12680| |
| Gene type | protein-coding |
| Map location | 17p11.2 |
| Pascal p-value | 0.087 |
| Sherlock p-value | 0.807 |
| Fetal beta | 0.258 |
| DMG | 1 (# studies) |
Gene in Data Sources
| Gene set name | Method of gene set | Description | Info |
|---|---|---|---|
| CV:PGCnp | Genome-wide Association Study | GWAS | |
| DMG:Jaffe_2016 | Genome-wide DNA methylation analysis | This dataset includes 2,104 probes/CpGs associated with SZ patients (n=108) compared to 136 controls at Bonferroni-adjusted P < 0.05. | 1 |
Section I. Genetics and epigenetics annotation
 Differentially methylated gene
| Probe | Chromosome | Position | Nearest gene | P (dis) | Beta (dis) | FDR (dis) | Study |
|---|---|---|---|---|---|---|---|
| cg20266104 | 17 | 21116851 | TMEM11 | 5.59E-10 | -0.023 | 8.9E-7 | DMG:Jaffe_2016 |
Section II. Transcriptome annotation
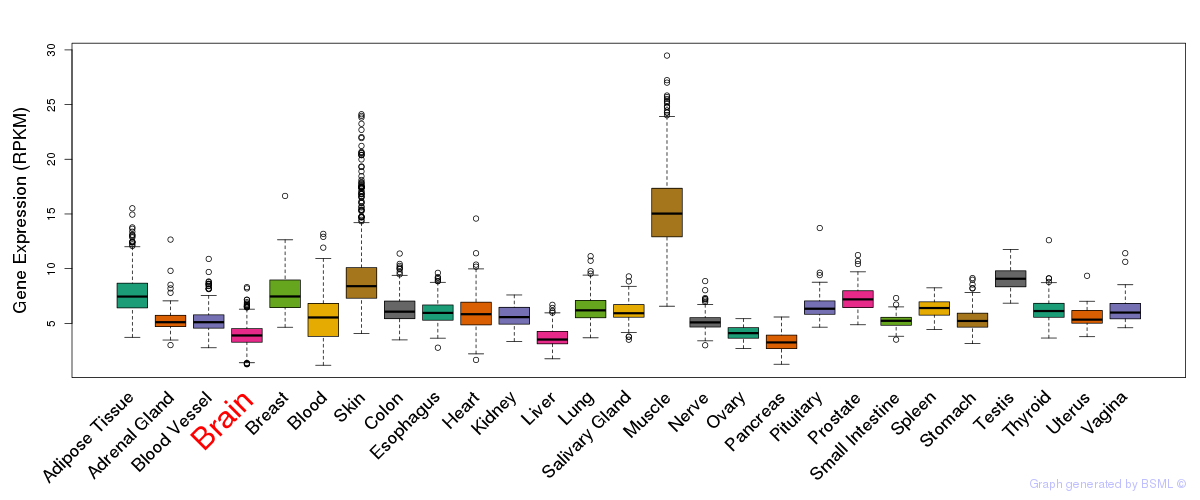
General gene expression (GTEx)
Gene expression during devlopment (BrainCloud)
Footnote:
A total of 269 time points ploted, with n=38 fetal samples (x=1:38). Each triangle represents one time point.
Gene expression of temporal and spatial changes (BrainSpan)
Footnote:
SC: sub-cortical regions; SM: sensory-motor regions; FC: frontal cortex; and TP: temporal-parietal cortex
ST1: fetal (13 - 26 postconception weeks), ST2: early infancy to late childhood (4 months to 11 years), and ST3: adolescence to adulthood (13 - 23 years)
The bar shown representes the lower 25% and upper 25% of the expression distribution.
Top co-expressed genes in brain regions
| Top 10 positively co-expressed genes | ||
| Gene | Pearson's Correlation | Spearman's Correlation |
| KCNJ12 | 0.81 | 0.73 |
| ZDHHC22 | 0.81 | 0.74 |
| GABBR2 | 0.80 | 0.80 |
| LRTM2 | 0.80 | 0.75 |
| PITPNM1 | 0.78 | 0.78 |
| AKAP2 | 0.78 | 0.58 |
| CIT | 0.78 | 0.69 |
| GPR123 | 0.77 | 0.78 |
| CRHR1 | 0.77 | 0.77 |
| BTBD11 | 0.77 | 0.62 |
| Top 10 negatively co-expressed genes | ||
| Gene | Pearson's Correlation | Spearman's Correlation |
| GNG11 | -0.33 | -0.40 |
| TPT1 | -0.33 | -0.34 |
| RPS20 | -0.33 | -0.43 |
| EMX2 | -0.33 | -0.48 |
| RAB13 | -0.32 | -0.42 |
| PECI | -0.32 | -0.42 |
| RPL31 | -0.31 | -0.35 |
| AF347015.21 | -0.31 | -0.27 |
| MYL12A | -0.31 | -0.42 |
| ACAA2 | -0.31 | -0.38 |
Section V. Pathway annotation
| Pathway name | Pathway size | # SZGR 2.0 genes in pathway | Info |
|---|---|---|---|
| WANG CLIM2 TARGETS DN | 186 | 114 | All SZGR 2.0 genes in this pathway |
| POMEROY MEDULLOBLASTOMA DESMOPLASIC VS CLASSIC UP | 62 | 38 | All SZGR 2.0 genes in this pathway |
| FLECHNER BIOPSY KIDNEY TRANSPLANT OK VS DONOR DN | 25 | 15 | All SZGR 2.0 genes in this pathway |
| GRADE COLON CANCER UP | 871 | 505 | All SZGR 2.0 genes in this pathway |
| HOSHIDA LIVER CANCER LATE RECURRENCE DN | 69 | 48 | All SZGR 2.0 genes in this pathway |
| YAO TEMPORAL RESPONSE TO PROGESTERONE CLUSTER 10 | 69 | 38 | All SZGR 2.0 genes in this pathway |