Gene Page: AP3D1
Summary ?
| GeneID | 8943 |
| Symbol | AP3D1 |
| Synonyms | ADTD|hBLVR |
| Description | adaptor related protein complex 3 delta 1 subunit |
| Reference | MIM:607246|HGNC:HGNC:568|Ensembl:ENSG00000065000|HPRD:06260|Vega:OTTHUMG00000180354 |
| Gene type | protein-coding |
| Map location | 19p13.3 |
| Pascal p-value | 0.027 |
| Sherlock p-value | 0.606 |
| TADA p-value | 0.022 |
| Fetal beta | -0.325 |
| DMG | 1 (# studies) |
| eGene | Caudate basal ganglia Putamen basal ganglia Meta |
| Support | ENDOCYTOSIS G2Cdb.human_BAYES-COLLINS-HUMAN-PSD-FULL CompositeSet Darnell FMRP targets Ascano FMRP targets |
Gene in Data Sources
| Gene set name | Method of gene set | Description | Info |
|---|---|---|---|
| CV:GWASdb | Genome-wide Association Studies | GWASdb records for schizophrenia | |
| CV:PGCnp | Genome-wide Association Study | GWAS | |
| DMG:Wockner_2014 | Genome-wide DNA methylation analysis | This dataset includes 4641 differentially methylated probes corresponding to 2929 unique genes between schizophrenia patients (n=24) and controls (n=24). | 1 |
| DNM:Fromer_2014 | Whole Exome Sequencing analysis | This study reported a WES study of 623 schizophrenia trios, reporting DNMs using genomic DNA. |
Section I. Genetics and epigenetics annotation
 DNM table
| Gene | Chromosome | Position | Ref | Alt | Transcript | AA change | Mutation type | Sift | CG46 | Trait | Study |
|---|---|---|---|---|---|---|---|---|---|---|---|
| AP3D1 | chr19 | 2117265 | G | C | NM_001261826 NM_003938 | p.605N>K p.605N>K | missense missense | Schizophrenia | DNM:Fromer_2014 |
Differentially methylated gene
| Probe | Chromosome | Position | Nearest gene | P (dis) | Beta (dis) | FDR (dis) | Study |
|---|---|---|---|---|---|---|---|
| cg14223017 | 19 | 2151266 | AP3D1 | 3.04E-5 | -0.257 | 0.019 | DMG:Wockner_2014 |
eQTL annotation
| SNP ID | Chromosome | Position | eGene | Gene Entrez ID | pvalue | qvalue | TSS distance | eQTL type |
|---|---|---|---|---|---|---|---|---|
| rs8100122 | 19 | 2106333 | AP3D1 | ENSG00000065000.11 | 1.274E-6 | 0.01 | 58131 | gtex_brain_putamen_basal |
| rs10413398 | 19 | 2106696 | AP3D1 | ENSG00000065000.11 | 1.472E-6 | 0.01 | 57768 | gtex_brain_putamen_basal |
| rs2072306 | 19 | 2109019 | AP3D1 | ENSG00000065000.11 | 1.439E-6 | 0.01 | 55445 | gtex_brain_putamen_basal |
| rs20567 | 19 | 2110746 | AP3D1 | ENSG00000065000.11 | 1.493E-6 | 0.01 | 53718 | gtex_brain_putamen_basal |
| rs2074959 | 19 | 2111649 | AP3D1 | ENSG00000065000.11 | 1.499E-6 | 0.01 | 52815 | gtex_brain_putamen_basal |
| rs2066775 | 19 | 2115493 | AP3D1 | ENSG00000065000.11 | 1.516E-6 | 0.01 | 48971 | gtex_brain_putamen_basal |
| rs9676693 | 19 | 2116400 | AP3D1 | ENSG00000065000.11 | 1.517E-6 | 0.01 | 48064 | gtex_brain_putamen_basal |
| rs734727 | 19 | 2116466 | AP3D1 | ENSG00000065000.11 | 1.517E-6 | 0.01 | 47998 | gtex_brain_putamen_basal |
| rs4807201 | 19 | 2120314 | AP3D1 | ENSG00000065000.11 | 9.295E-8 | 0.01 | 44150 | gtex_brain_putamen_basal |
| rs72450613 | 19 | 2122206 | AP3D1 | ENSG00000065000.11 | 1.736E-6 | 0.01 | 42258 | gtex_brain_putamen_basal |
| rs4807203 | 19 | 2127272 | AP3D1 | ENSG00000065000.11 | 8.736E-7 | 0.01 | 37192 | gtex_brain_putamen_basal |
| rs77347571 | 19 | 2136680 | AP3D1 | ENSG00000065000.11 | 9.648E-7 | 0.01 | 27784 | gtex_brain_putamen_basal |
Section II. Transcriptome annotation
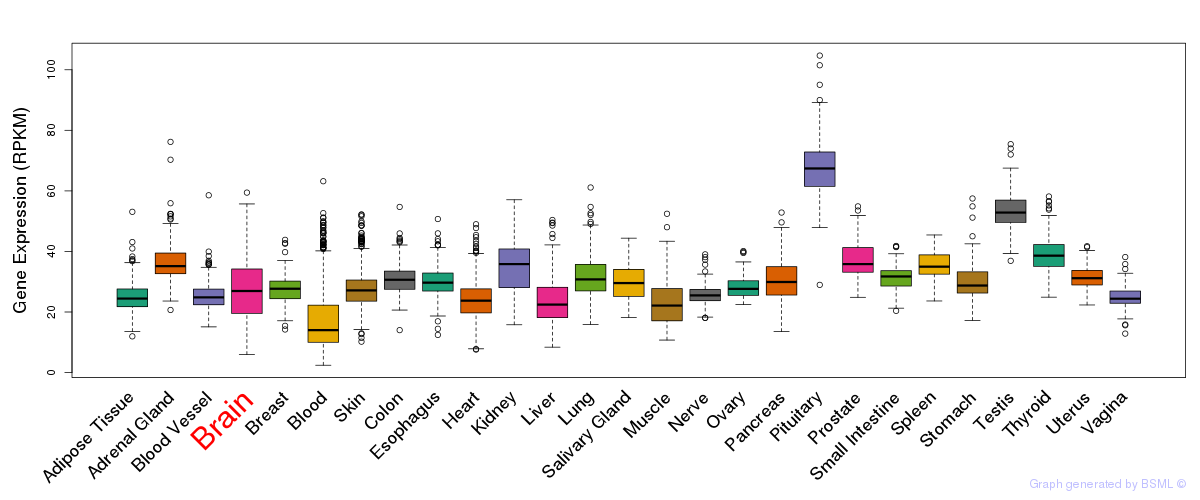
General gene expression (GTEx)
Gene expression during devlopment (BrainCloud)
Footnote:
A total of 269 time points ploted, with n=38 fetal samples (x=1:38). Each triangle represents one time point.
Gene expression of temporal and spatial changes (BrainSpan)
Footnote:
SC: sub-cortical regions; SM: sensory-motor regions; FC: frontal cortex; and TP: temporal-parietal cortex
ST1: fetal (13 - 26 postconception weeks), ST2: early infancy to late childhood (4 months to 11 years), and ST3: adolescence to adulthood (13 - 23 years)
The bar shown representes the lower 25% and upper 25% of the expression distribution.
No co-expressed genes in brain regions
Section V. Pathway annotation
| Pathway name | Pathway size | # SZGR 2.0 genes in pathway | Info |
|---|---|---|---|
| KEGG LYSOSOME | 121 | 83 | All SZGR 2.0 genes in this pathway |
| THUM SYSTOLIC HEART FAILURE DN | 244 | 147 | All SZGR 2.0 genes in this pathway |
| OSWALD HEMATOPOIETIC STEM CELL IN COLLAGEN GEL DN | 275 | 168 | All SZGR 2.0 genes in this pathway |
| RODRIGUES THYROID CARCINOMA ANAPLASTIC UP | 722 | 443 | All SZGR 2.0 genes in this pathway |
| GRAESSMANN APOPTOSIS BY DOXORUBICIN DN | 1781 | 1082 | All SZGR 2.0 genes in this pathway |
| MATTIOLI MGUS VS PCL | 116 | 62 | All SZGR 2.0 genes in this pathway |
| SCHLOSSER SERUM RESPONSE DN | 712 | 443 | All SZGR 2.0 genes in this pathway |
| RICKMAN METASTASIS DN | 261 | 155 | All SZGR 2.0 genes in this pathway |
| BENPORATH CYCLING GENES | 648 | 385 | All SZGR 2.0 genes in this pathway |
| FLECHNER BIOPSY KIDNEY TRANSPLANT REJECTED VS OK DN | 546 | 351 | All SZGR 2.0 genes in this pathway |
| FLECHNER BIOPSY KIDNEY TRANSPLANT OK VS DONOR UP | 555 | 346 | All SZGR 2.0 genes in this pathway |
| CHIARETTI ACUTE LYMPHOBLASTIC LEUKEMIA ZAP70 | 67 | 33 | All SZGR 2.0 genes in this pathway |
| WELCSH BRCA1 TARGETS DN | 141 | 92 | All SZGR 2.0 genes in this pathway |
| MITSIADES RESPONSE TO APLIDIN DN | 249 | 165 | All SZGR 2.0 genes in this pathway |
| WHITFIELD CELL CYCLE G2 | 182 | 102 | All SZGR 2.0 genes in this pathway |
| WAKABAYASHI ADIPOGENESIS PPARG BOUND 8D | 658 | 397 | All SZGR 2.0 genes in this pathway |