Gene Page: TAF1C
Summary ?
| GeneID | 9013 |
| Symbol | TAF1C |
| Synonyms | MGC:39976|SL1|TAFI110|TAFI95 |
| Description | TATA-box binding protein associated factor, RNA polymerase I subunit C |
| Reference | MIM:604905|HGNC:HGNC:11534|Ensembl:ENSG00000103168|HPRD:05364|Vega:OTTHUMG00000176665 |
| Gene type | protein-coding |
| Map location | 16q24 |
| Pascal p-value | 0.743 |
| Sherlock p-value | 0.602 |
| Fetal beta | 0.983 |
| eGene | Caudate basal ganglia Cerebellar Hemisphere Cerebellum Cortex Hippocampus Hypothalamus Nucleus accumbens basal ganglia Putamen basal ganglia Myers' cis & trans Meta |
| Support | CompositeSet |
Gene in Data Sources
| Gene set name | Method of gene set | Description | Info |
|---|---|---|---|
| DNM:Fromer_2014 | Whole Exome Sequencing analysis | This study reported a WES study of 623 schizophrenia trios, reporting DNMs using genomic DNA. |
Section I. Genetics and epigenetics annotation
 DNM table
| Gene | Chromosome | Position | Ref | Alt | Transcript | AA change | Mutation type | Sift | CG46 | Trait | Study |
|---|---|---|---|---|---|---|---|---|---|---|---|
| TAF1C | chr16 | 84213434 | A | T | NM_001243156 NM_001243157 NM_001243158 NM_001243159 NM_001243160 NM_005679 NM_139353 | p.549L>M p.243L>M p.243L>M p.166L>M p.98L>M p.575L>M p.481L>M | missense missense missense missense missense missense missense | Schizophrenia | DNM:Fromer_2014 |
eQTL annotation
| SNP ID | Chromosome | Position | eGene | Gene Entrez ID | pvalue | qvalue | TSS distance | eQTL type |
|---|---|---|---|---|---|---|---|---|
| rs2081247 | chr16 | 84221961 | TAF1C | 9013 | 0.1 | cis | ||
| rs4489992 | 16 | 84206843 | TAF1C | ENSG00000103168.12 | 1.398E-7 | 0 | 13826 | gtex_brain_putamen_basal |
| rs3803643 | 16 | 84208032 | TAF1C | ENSG00000103168.12 | 1.164E-8 | 0 | 12637 | gtex_brain_putamen_basal |
| rs3803642 | 16 | 84208144 | TAF1C | ENSG00000103168.12 | 1.122E-8 | 0 | 12525 | gtex_brain_putamen_basal |
| rs12597741 | 16 | 84208667 | TAF1C | ENSG00000103168.12 | 7.822E-8 | 0 | 12002 | gtex_brain_putamen_basal |
| rs12597782 | 16 | 84208891 | TAF1C | ENSG00000103168.12 | 8.053E-8 | 0 | 11778 | gtex_brain_putamen_basal |
| rs34693209 | 16 | 84209138 | TAF1C | ENSG00000103168.12 | 1.161E-8 | 0 | 11531 | gtex_brain_putamen_basal |
| rs2288019 | 16 | 84209634 | TAF1C | ENSG00000103168.12 | 5.422E-7 | 0 | 11035 | gtex_brain_putamen_basal |
| rs3743637 | 16 | 84210172 | TAF1C | ENSG00000103168.12 | 5.573E-7 | 0 | 10497 | gtex_brain_putamen_basal |
| rs11149630 | 16 | 84210749 | TAF1C | ENSG00000103168.12 | 5.452E-7 | 0 | 9920 | gtex_brain_putamen_basal |
| rs8692 | 16 | 84211483 | TAF1C | ENSG00000103168.12 | 5.184E-7 | 0 | 9186 | gtex_brain_putamen_basal |
| rs2278043 | 16 | 84213965 | TAF1C | ENSG00000103168.12 | 2.613E-9 | 0 | 6704 | gtex_brain_putamen_basal |
| rs2303234 | 16 | 84214837 | TAF1C | ENSG00000103168.12 | 1.415E-7 | 0 | 5832 | gtex_brain_putamen_basal |
| rs3815814 | 16 | 84215314 | TAF1C | ENSG00000103168.12 | 1.486E-7 | 0 | 5355 | gtex_brain_putamen_basal |
Section II. Transcriptome annotation
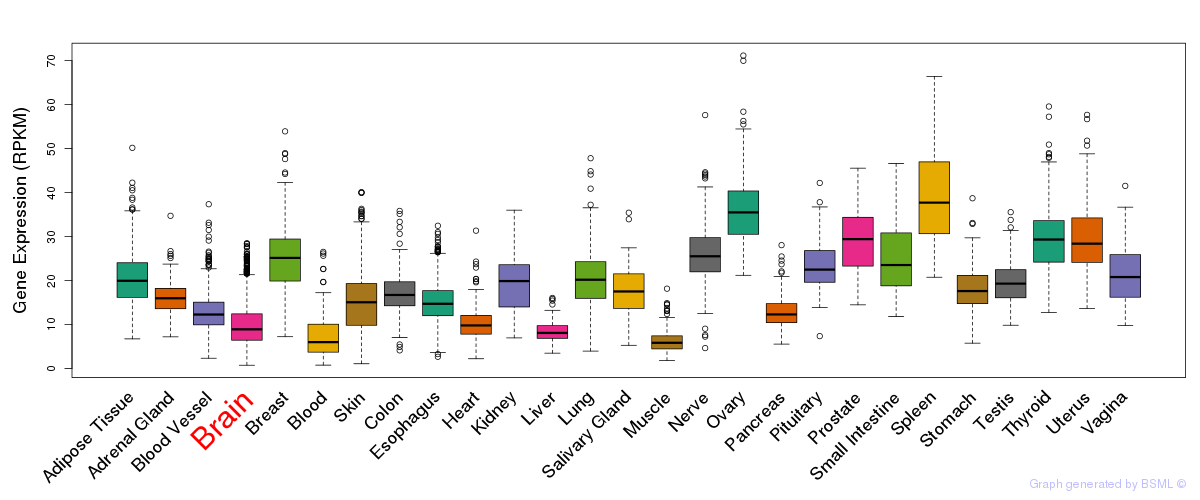
General gene expression (GTEx)
Gene expression during devlopment (BrainCloud)
Footnote:
A total of 269 time points ploted, with n=38 fetal samples (x=1:38). Each triangle represents one time point.
Gene expression of temporal and spatial changes (BrainSpan)
Footnote:
SC: sub-cortical regions; SM: sensory-motor regions; FC: frontal cortex; and TP: temporal-parietal cortex
ST1: fetal (13 - 26 postconception weeks), ST2: early infancy to late childhood (4 months to 11 years), and ST3: adolescence to adulthood (13 - 23 years)
The bar shown representes the lower 25% and upper 25% of the expression distribution.
Top co-expressed genes in brain regions
| Top 10 positively co-expressed genes | ||
| Gene | Pearson's Correlation | Spearman's Correlation |
| DDX49 | 0.95 | 0.95 |
| PRMT1 | 0.93 | 0.95 |
| EIF6 | 0.93 | 0.93 |
| RUVBL2 | 0.92 | 0.94 |
| CECR5 | 0.92 | 0.93 |
| CFL1 | 0.91 | 0.92 |
| ARMC6 | 0.91 | 0.94 |
| EBP | 0.91 | 0.93 |
| ACTL6B | 0.91 | 0.92 |
| WDR74 | 0.91 | 0.93 |
| Top 10 negatively co-expressed genes | ||
| Gene | Pearson's Correlation | Spearman's Correlation |
| AF347015.33 | -0.75 | -0.83 |
| AF347015.27 | -0.75 | -0.82 |
| AF347015.8 | -0.74 | -0.82 |
| MT-CO2 | -0.74 | -0.79 |
| AF347015.31 | -0.74 | -0.80 |
| MT-CYB | -0.74 | -0.82 |
| AF347015.15 | -0.73 | -0.82 |
| AF347015.2 | -0.72 | -0.83 |
| AF347015.26 | -0.70 | -0.82 |
| AF347015.9 | -0.67 | -0.78 |
Section V. Pathway annotation
| Pathway name | Pathway size | # SZGR 2.0 genes in pathway | Info |
|---|---|---|---|
| REACTOME RNA POL I TRANSCRIPTION TERMINATION | 22 | 12 | All SZGR 2.0 genes in this pathway |
| REACTOME RNA POL I TRANSCRIPTION | 89 | 64 | All SZGR 2.0 genes in this pathway |
| REACTOME TRANSCRIPTION | 210 | 127 | All SZGR 2.0 genes in this pathway |
| REACTOME RNA POL I RNA POL III AND MITOCHONDRIAL TRANSCRIPTION | 122 | 80 | All SZGR 2.0 genes in this pathway |
| REACTOME RNA POL I TRANSCRIPTION INITIATION | 25 | 14 | All SZGR 2.0 genes in this pathway |
| GINESTIER BREAST CANCER ZNF217 AMPLIFIED DN | 335 | 193 | All SZGR 2.0 genes in this pathway |
| RASHI RESPONSE TO IONIZING RADIATION 3 | 48 | 31 | All SZGR 2.0 genes in this pathway |
| PUJANA BRCA2 PCC NETWORK | 423 | 265 | All SZGR 2.0 genes in this pathway |
| RICKMAN METASTASIS UP | 344 | 180 | All SZGR 2.0 genes in this pathway |
| DEBIASI APOPTOSIS BY REOVIRUS INFECTION UP | 314 | 201 | All SZGR 2.0 genes in this pathway |
| WELCSH BRCA1 TARGETS DN | 141 | 92 | All SZGR 2.0 genes in this pathway |
| KYNG ENVIRONMENTAL STRESS RESPONSE NOT BY 4NQO IN OLD | 13 | 10 | All SZGR 2.0 genes in this pathway |
| KYNG ENVIRONMENTAL STRESS RESPONSE NOT BY 4NQO IN WS | 40 | 26 | All SZGR 2.0 genes in this pathway |
| KYNG ENVIRONMENTAL STRESS RESPONSE NOT BY GAMMA IN OLD | 31 | 19 | All SZGR 2.0 genes in this pathway |
| KYNG ENVIRONMENTAL STRESS RESPONSE NOT BY GAMMA IN WS | 33 | 22 | All SZGR 2.0 genes in this pathway |
| KYNG ENVIRONMENTAL STRESS RESPONSE NOT BY UV IN OLD | 25 | 18 | All SZGR 2.0 genes in this pathway |
| KYNG ENVIRONMENTAL STRESS RESPONSE NOT BY UV IN WS | 12 | 9 | All SZGR 2.0 genes in this pathway |
| KYNG DNA DAMAGE DN | 195 | 135 | All SZGR 2.0 genes in this pathway |
| KYNG ENVIRONMENTAL STRESS RESPONSE UP | 56 | 41 | All SZGR 2.0 genes in this pathway |
| MALONEY RESPONSE TO 17AAG UP | 41 | 26 | All SZGR 2.0 genes in this pathway |
| MILI PSEUDOPODIA HAPTOTAXIS DN | 668 | 419 | All SZGR 2.0 genes in this pathway |
| HOSHIDA LIVER CANCER SURVIVAL DN | 113 | 76 | All SZGR 2.0 genes in this pathway |