Gene Page: TAF1A
Summary ?
| GeneID | 9015 |
| Symbol | TAF1A |
| Synonyms | MGC:17061|RAFI48|SL1|TAFI48 |
| Description | TATA-box binding protein associated factor, RNA polymerase I subunit A |
| Reference | MIM:604903|HGNC:HGNC:11532|Ensembl:ENSG00000143498|HPRD:05362|Vega:OTTHUMG00000037544 |
| Gene type | protein-coding |
| Map location | 1q42 |
| Fetal beta | 1.961 |
| DMG | 1 (# studies) |
Gene in Data Sources
| Gene set name | Method of gene set | Description | Info |
|---|---|---|---|
| CV:PGCnp | Genome-wide Association Study | GWAS | |
| DMG:Jaffe_2016 | Genome-wide DNA methylation analysis | This dataset includes 2,104 probes/CpGs associated with SZ patients (n=108) compared to 136 controls at Bonferroni-adjusted P < 0.05. | 1 |
Section I. Genetics and epigenetics annotation
 Differentially methylated gene
| Probe | Chromosome | Position | Nearest gene | P (dis) | Beta (dis) | FDR (dis) | Study |
|---|---|---|---|---|---|---|---|
| cg25385272 | 1 | 222763149 | TAF1A | 5.14E-9 | -0.016 | 2.9E-6 | DMG:Jaffe_2016 |
Section II. Transcriptome annotation
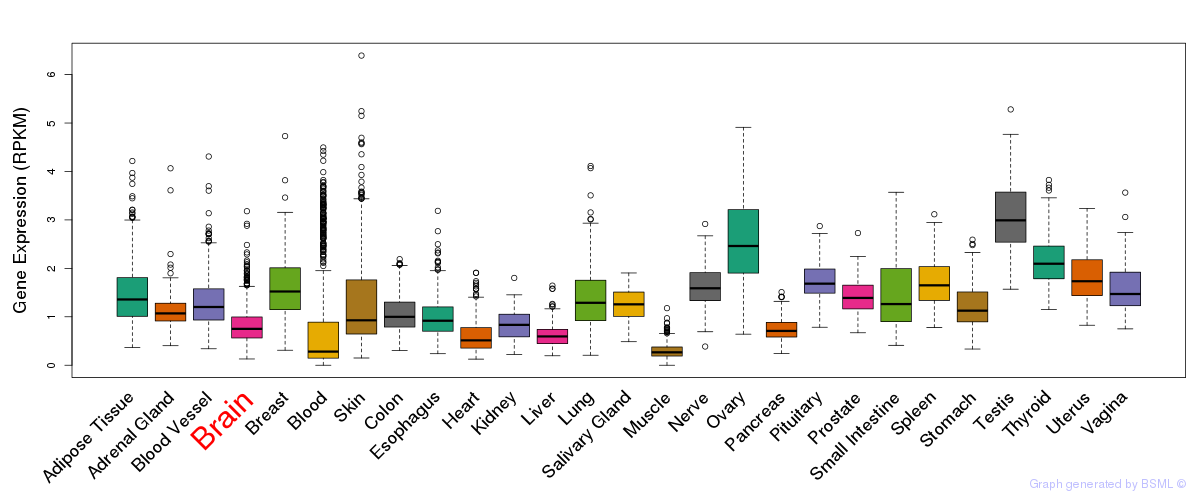
General gene expression (GTEx)
Gene expression during devlopment (BrainCloud)
Footnote:
A total of 269 time points ploted, with n=38 fetal samples (x=1:38). Each triangle represents one time point.
Gene expression of temporal and spatial changes (BrainSpan)
Footnote:
SC: sub-cortical regions; SM: sensory-motor regions; FC: frontal cortex; and TP: temporal-parietal cortex
ST1: fetal (13 - 26 postconception weeks), ST2: early infancy to late childhood (4 months to 11 years), and ST3: adolescence to adulthood (13 - 23 years)
The bar shown representes the lower 25% and upper 25% of the expression distribution.
Top co-expressed genes in brain regions
| Top 10 positively co-expressed genes | ||
| Gene | Pearson's Correlation | Spearman's Correlation |
| MYO15B | 0.83 | 0.88 |
| TYK2 | 0.82 | 0.80 |
| LRCH4 | 0.81 | 0.83 |
| AC069281.3 | 0.80 | 0.81 |
| MYO15B | 0.79 | 0.82 |
| NPEPL1 | 0.79 | 0.82 |
| MYO9B | 0.78 | 0.81 |
| PILRB | 0.77 | 0.80 |
| SCNN1D | 0.76 | 0.79 |
| PLD2 | 0.76 | 0.78 |
| Top 10 negatively co-expressed genes | ||
| Gene | Pearson's Correlation | Spearman's Correlation |
| CAPZA2 | -0.47 | -0.53 |
| CALM2 | -0.45 | -0.47 |
| TMEM70 | -0.45 | -0.50 |
| BRP44 | -0.44 | -0.51 |
| DNAJB9 | -0.44 | -0.49 |
| NDUFB5 | -0.44 | -0.55 |
| SNX3 | -0.44 | -0.47 |
| C18orf32 | -0.43 | -0.59 |
| CISD1 | -0.43 | -0.46 |
| CACYBP | -0.42 | -0.45 |
Section V. Pathway annotation
| Pathway name | Pathway size | # SZGR 2.0 genes in pathway | Info |
|---|---|---|---|
| REACTOME RNA POL I TRANSCRIPTION TERMINATION | 22 | 12 | All SZGR 2.0 genes in this pathway |
| REACTOME RNA POL I TRANSCRIPTION | 89 | 64 | All SZGR 2.0 genes in this pathway |
| REACTOME TRANSCRIPTION | 210 | 127 | All SZGR 2.0 genes in this pathway |
| REACTOME RNA POL I RNA POL III AND MITOCHONDRIAL TRANSCRIPTION | 122 | 80 | All SZGR 2.0 genes in this pathway |
| REACTOME RNA POL I TRANSCRIPTION INITIATION | 25 | 14 | All SZGR 2.0 genes in this pathway |
| GAZDA DIAMOND BLACKFAN ANEMIA ERYTHROID DN | 493 | 298 | All SZGR 2.0 genes in this pathway |
| TIEN INTESTINE PROBIOTICS 2HR DN | 88 | 53 | All SZGR 2.0 genes in this pathway |
| KINSEY TARGETS OF EWSR1 FLII FUSION UP | 1278 | 748 | All SZGR 2.0 genes in this pathway |
| DODD NASOPHARYNGEAL CARCINOMA DN | 1375 | 806 | All SZGR 2.0 genes in this pathway |
| GRAESSMANN APOPTOSIS BY SERUM DEPRIVATION UP | 552 | 347 | All SZGR 2.0 genes in this pathway |
| FARMER BREAST CANCER APOCRINE VS BASAL | 330 | 217 | All SZGR 2.0 genes in this pathway |
| WEI MYCN TARGETS WITH E BOX | 795 | 478 | All SZGR 2.0 genes in this pathway |
| DEBIASI APOPTOSIS BY REOVIRUS INFECTION UP | 314 | 201 | All SZGR 2.0 genes in this pathway |
| BROWNE HCMV INFECTION 14HR UP | 156 | 101 | All SZGR 2.0 genes in this pathway |
| CHEN HOXA5 TARGETS 9HR UP | 223 | 132 | All SZGR 2.0 genes in this pathway |
| TOOKER GEMCITABINE RESISTANCE DN | 122 | 84 | All SZGR 2.0 genes in this pathway |
| WINNEPENNINCKX MELANOMA METASTASIS UP | 162 | 86 | All SZGR 2.0 genes in this pathway |
| PEDERSEN METASTASIS BY ERBB2 ISOFORM 6 | 29 | 20 | All SZGR 2.0 genes in this pathway |