Gene Page: BRSK2
Summary ?
| GeneID | 9024 |
| Symbol | BRSK2 |
| Synonyms | C11orf7|PEN11B|SAD1|SADA|STK29 |
| Description | BR serine/threonine kinase 2 |
| Reference | MIM:609236|HGNC:HGNC:11405|Ensembl:ENSG00000174672|Vega:OTTHUMG00000167089 |
| Gene type | protein-coding |
| Map location | 11p15.5 |
| Pascal p-value | 0.01 |
| Sherlock p-value | 0.84 |
| Fetal beta | 0.009 |
| DMG | 2 (# studies) |
| eGene | Myers' cis & trans |
| Support | CompositeSet Darnell FMRP targets |
Gene in Data Sources
| Gene set name | Method of gene set | Description | Info |
|---|---|---|---|
| CV:PGCnp | Genome-wide Association Study | GWAS | |
| DMG:Jaffe_2016 | Genome-wide DNA methylation analysis | This dataset includes 2,104 probes/CpGs associated with SZ patients (n=108) compared to 136 controls at Bonferroni-adjusted P < 0.05. | 4 |
| DMG:Wockner_2014 | Genome-wide DNA methylation analysis | This dataset includes 4641 differentially methylated probes corresponding to 2929 unique genes between schizophrenia patients (n=24) and controls (n=24). | 4 |
| GO_Annotation | Mapping neuro-related keywords to Gene Ontology annotations | Hits with neuro-related keywords: 1 |
Section I. Genetics and epigenetics annotation
 Differentially methylated gene
| Probe | Chromosome | Position | Nearest gene | P (dis) | Beta (dis) | FDR (dis) | Study |
|---|---|---|---|---|---|---|---|
| cg07652408 | 11 | 1459488 | BRSK2 | 3.89E-5 | 0.356 | 0.02 | DMG:Wockner_2014 |
| cg06787104 | 11 | 1457119 | BRSK2 | 2.276E-4 | -0.218 | 0.036 | DMG:Wockner_2014 |
| cg06300961 | 11 | 1459507 | BRSK2 | 5.85E-4 | 0.291 | 0.049 | DMG:Wockner_2014 |
| cg14021073 | 11 | 1410385 | BRSK2 | 1.63E-8 | -0.01 | 6.01E-6 | DMG:Jaffe_2016 |
eQTL annotation
| SNP ID | Chromosome | Position | eGene | Gene Entrez ID | pvalue | qvalue | TSS distance | eQTL type |
|---|---|---|---|---|---|---|---|---|
| rs6733654 | chr2 | 1963270 | BRSK2 | 9024 | 0.04 | trans | ||
| rs9637082 | chr21 | 21213235 | BRSK2 | 9024 | 2.545E-4 | trans |
Section II. Transcriptome annotation
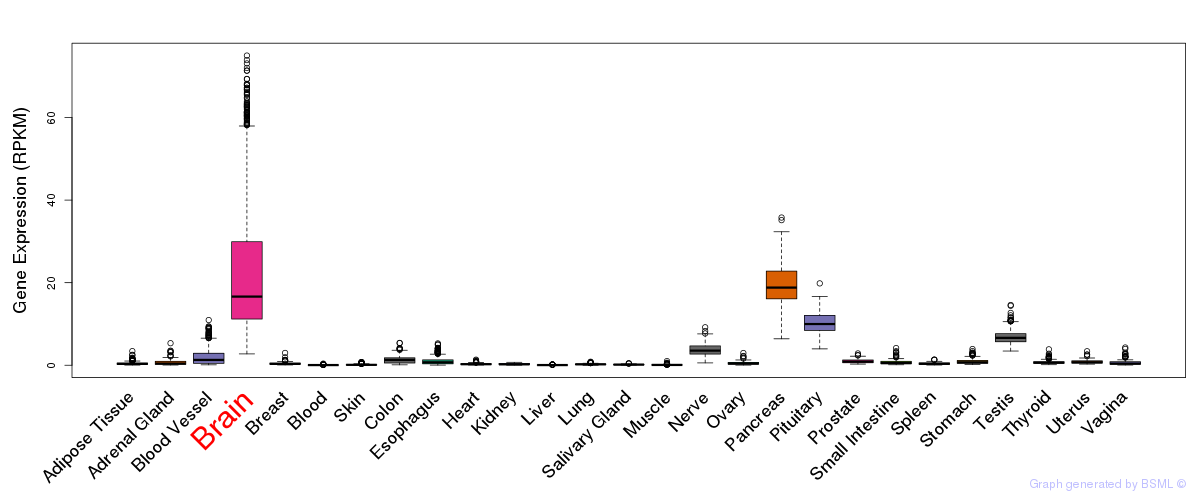
General gene expression (GTEx)
Gene expression during devlopment (BrainCloud)
Footnote:
A total of 269 time points ploted, with n=38 fetal samples (x=1:38). Each triangle represents one time point.
Gene expression of temporal and spatial changes (BrainSpan)
Footnote:
SC: sub-cortical regions; SM: sensory-motor regions; FC: frontal cortex; and TP: temporal-parietal cortex
ST1: fetal (13 - 26 postconception weeks), ST2: early infancy to late childhood (4 months to 11 years), and ST3: adolescence to adulthood (13 - 23 years)
The bar shown representes the lower 25% and upper 25% of the expression distribution.
Top co-expressed genes in brain regions
| Top 10 positively co-expressed genes | ||
| Gene | Pearson's Correlation | Spearman's Correlation |
| MPHOSPH8 | 0.89 | 0.90 |
| GOLGB1 | 0.89 | 0.90 |
| ANKRD26 | 0.87 | 0.89 |
| CDC42BPA | 0.86 | 0.88 |
| KIF21A | 0.85 | 0.87 |
| GOLGA4 | 0.85 | 0.87 |
| EEA1 | 0.84 | 0.87 |
| FMR1 | 0.84 | 0.86 |
| DST | 0.83 | 0.84 |
| KIF3A | 0.83 | 0.85 |
| Top 10 negatively co-expressed genes | ||
| Gene | Pearson's Correlation | Spearman's Correlation |
| ENHO | -0.64 | -0.69 |
| METRN | -0.55 | -0.56 |
| AF347015.21 | -0.55 | -0.49 |
| C1orf61 | -0.55 | -0.62 |
| AF347015.31 | -0.54 | -0.52 |
| HIGD1B | -0.54 | -0.53 |
| VAMP5 | -0.53 | -0.54 |
| IFI27 | -0.53 | -0.51 |
| CLDN5 | -0.52 | -0.56 |
| C1orf54 | -0.52 | -0.55 |
Section III. Gene Ontology annotation
| Molecular function | GO term | Evidence | Neuro keywords | PubMed ID |
|---|---|---|---|---|
| GO:0000166 | nucleotide binding | IEA | - | |
| GO:0000287 | magnesium ion binding | IDA | 14976552 | |
| GO:0005524 | ATP binding | IDA | 14976552 | |
| GO:0004674 | protein serine/threonine kinase activity | IDA | 14976552 | |
| GO:0004674 | protein serine/threonine kinase activity | IEA | - | |
| GO:0016740 | transferase activity | IEA | - | |
| GO:0016301 | kinase activity | IEA | - | |
| Biological process | GO term | Evidence | Neuro keywords | PubMed ID |
| GO:0030182 | neuron differentiation | ISS | neuron (GO term level: 8) | - |
| GO:0006468 | protein amino acid phosphorylation | IDA | 14976552 | |
| GO:0030010 | establishment of cell polarity | ISS | - |
Section V. Pathway annotation
| Pathway name | Pathway size | # SZGR 2.0 genes in pathway | Info |
|---|---|---|---|
| PID LKB1 PATHWAY | 47 | 37 | All SZGR 2.0 genes in this pathway |
| DARWICHE SKIN TUMOR PROMOTER DN | 185 | 115 | All SZGR 2.0 genes in this pathway |
| DARWICHE PAPILLOMA RISK LOW DN | 165 | 107 | All SZGR 2.0 genes in this pathway |
| DARWICHE PAPILLOMA RISK HIGH DN | 180 | 110 | All SZGR 2.0 genes in this pathway |
| DARWICHE SQUAMOUS CELL CARCINOMA DN | 181 | 107 | All SZGR 2.0 genes in this pathway |
| MARTORIATI MDM4 TARGETS NEUROEPITHELIUM DN | 164 | 111 | All SZGR 2.0 genes in this pathway |
| BROWNE HCMV INFECTION 48HR DN | 504 | 323 | All SZGR 2.0 genes in this pathway |
| CAMPS COLON CANCER COPY NUMBER UP | 92 | 45 | All SZGR 2.0 genes in this pathway |
| HANN RESISTANCE TO BCL2 INHIBITOR UP | 36 | 24 | All SZGR 2.0 genes in this pathway |
| GRADE COLON CANCER UP | 871 | 505 | All SZGR 2.0 genes in this pathway |
| MEISSNER NPC HCP WITH H3K4ME2 | 491 | 319 | All SZGR 2.0 genes in this pathway |
| MIKKELSEN MCV6 HCP WITH H3K27ME3 | 435 | 318 | All SZGR 2.0 genes in this pathway |
| MIKKELSEN MEF HCP WITH H3K27ME3 | 590 | 403 | All SZGR 2.0 genes in this pathway |
| MARTENS TRETINOIN RESPONSE UP | 857 | 456 | All SZGR 2.0 genes in this pathway |
| BRUINS UVC RESPONSE VIA TP53 GROUP A | 898 | 516 | All SZGR 2.0 genes in this pathway |
Section VI. microRNA annotation
| miRNA family | Target position | miRNA ID | miRNA seq | ||
|---|---|---|---|---|---|
| UTR start | UTR end | Match method | |||
| miR-22 | 37 | 43 | m8 | hsa-miR-22brain | AAGCUGCCAGUUGAAGAACUGU |
- SZ: miRNAs which differentially expressed in brain cortex of schizophrenia patients comparing with control samples using microarray. Click here to see the list of SZ related miRNAs.
- Brain: miRNAs which are expressed in brain based on miRNA microarray expression studies. Click here to see the list of brain related miRNAs.