Gene Page: PKD2L1
Summary ?
| GeneID | 9033 |
| Symbol | PKD2L1 |
| Synonyms | PCL|PKD2L|PKDL|TRPP3 |
| Description | polycystin 2 like 1, transient receptor potential cation channel |
| Reference | MIM:604532|HGNC:HGNC:9011|Ensembl:ENSG00000107593|HPRD:16063|Vega:OTTHUMG00000018910 |
| Gene type | protein-coding |
| Map location | 10q24 |
| Pascal p-value | 2.133E-4 |
| Sherlock p-value | 0.295 |
| Fetal beta | -3.08 |
| eGene | Cortex Myers' cis & trans Meta |
Gene in Data Sources
| Gene set name | Method of gene set | Description | Info |
|---|---|---|---|
| CV:PGCnp | Genome-wide Association Study | GWAS | |
| PMID:cooccur | High-throughput literature-search | Systematic search in PubMed for genes co-occurring with SCZ keywords. A total of 3027 genes were included. | |
| Literature | High-throughput literature-search | Co-occurance with Schizophrenia keywords: schizophrenia,schizophrenias | Click to show details |
Section I. Genetics and epigenetics annotation
 eQTL annotation
| SNP ID | Chromosome | Position | eGene | Gene Entrez ID | pvalue | qvalue | TSS distance | eQTL type |
|---|---|---|---|---|---|---|---|---|
| rs2371122 | chr3 | 27858222 | PKD2L1 | 9033 | 0.04 | trans |
Section II. Transcriptome annotation
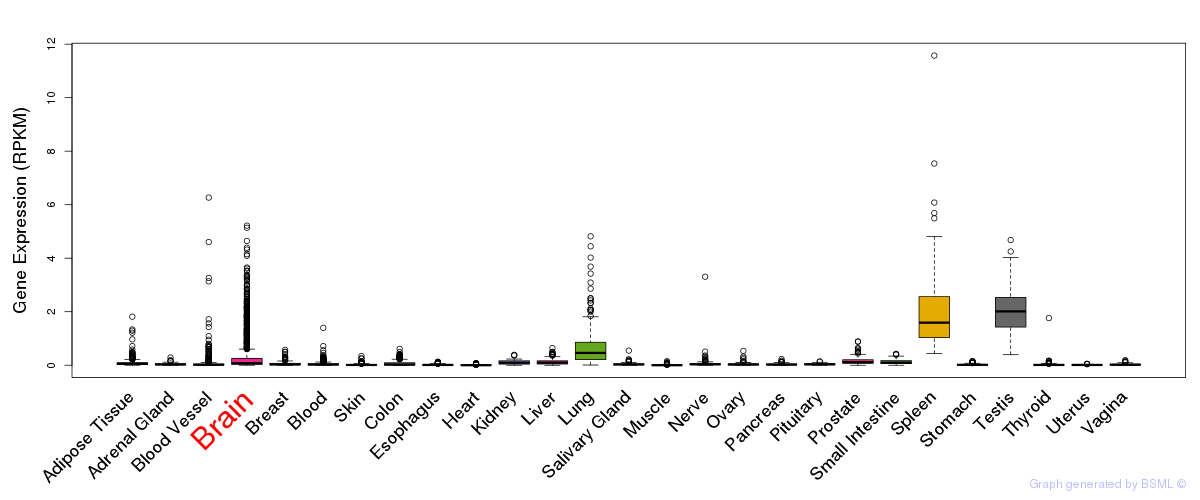
General gene expression (GTEx)
Gene expression during devlopment (BrainCloud)
Footnote:
A total of 269 time points ploted, with n=38 fetal samples (x=1:38). Each triangle represents one time point.
Gene expression of temporal and spatial changes (BrainSpan)
Footnote:
SC: sub-cortical regions; SM: sensory-motor regions; FC: frontal cortex; and TP: temporal-parietal cortex
ST1: fetal (13 - 26 postconception weeks), ST2: early infancy to late childhood (4 months to 11 years), and ST3: adolescence to adulthood (13 - 23 years)
The bar shown representes the lower 25% and upper 25% of the expression distribution.
Top co-expressed genes in brain regions
| Top 10 positively co-expressed genes | ||
| Gene | Pearson's Correlation | Spearman's Correlation |
| MELK | 0.99 | 0.76 |
| SGOL1 | 0.99 | 0.70 |
| CDCA2 | 0.98 | 0.72 |
| BUB1 | 0.98 | 0.78 |
| DLGAP5 | 0.98 | 0.76 |
| TPX2 | 0.98 | 0.87 |
| KIF23 | 0.98 | 0.79 |
| BUB1B | 0.98 | 0.78 |
| KIF11 | 0.98 | 0.85 |
| CCNB2 | 0.98 | 0.70 |
| Top 10 negatively co-expressed genes | ||
| Gene | Pearson's Correlation | Spearman's Correlation |
| SLC9A3R2 | -0.37 | -0.47 |
| HLA-F | -0.36 | -0.71 |
| PTH1R | -0.36 | -0.63 |
| C5orf53 | -0.36 | -0.61 |
| FBXO2 | -0.35 | -0.55 |
| TNFSF12 | -0.35 | -0.56 |
| AIFM3 | -0.35 | -0.65 |
| AF347015.27 | -0.34 | -0.72 |
| S100B | -0.34 | -0.69 |
| AF347015.31 | -0.34 | -0.72 |
Section V. Pathway annotation
| Pathway name | Pathway size | # SZGR 2.0 genes in pathway | Info |
|---|---|---|---|
| TSAI RESPONSE TO IONIZING RADIATION | 149 | 101 | All SZGR 2.0 genes in this pathway |
| WAKABAYASHI ADIPOGENESIS PPARG RXRA BOUND 8D | 882 | 506 | All SZGR 2.0 genes in this pathway |
| FOSTER KDM1A TARGETS UP | 266 | 142 | All SZGR 2.0 genes in this pathway |