Gene Page: TMEM55B
Summary ?
| GeneID | 90809 |
| Symbol | TMEM55B |
| Synonyms | C14orf9 |
| Description | transmembrane protein 55B |
| Reference | MIM:609865|HGNC:HGNC:19299|Ensembl:ENSG00000165782|HPRD:12660|Vega:OTTHUMG00000029545 |
| Gene type | protein-coding |
| Map location | 14q11.2 |
| Pascal p-value | 0.718 |
| Sherlock p-value | 0.775 |
| Fetal beta | -0.636 |
| eGene | Myers' cis & trans |
Gene in Data Sources
| Gene set name | Method of gene set | Description | Info |
|---|---|---|---|
| DNM:Guipponi_2014 | Whole Exome Sequencing analysis | 49 DNMs were identified by comparing the exome of 53 individuals with sporadic SCZ and of their non-affected parents | |
| GSMA_I | Genome scan meta-analysis | Psr: 0.047 |
Section I. Genetics and epigenetics annotation
 DNM table
| Gene | Chromosome | Position | Ref | Alt | Transcript | AA change | Mutation type | Sift | CG46 | Trait | Study |
|---|---|---|---|---|---|---|---|---|---|---|---|
| TMEM55B | G | A | NM_001100814 | p.V100V | synonymous | NA | NA | Schizophrenia | DNM:Guipponi_2014 |
eQTL annotation
| SNP ID | Chromosome | Position | eGene | Gene Entrez ID | pvalue | qvalue | TSS distance | eQTL type |
|---|---|---|---|---|---|---|---|---|
| rs921442 | chr11 | 57920868 | TMEM55B | 90809 | 0.14 | trans | ||
| rs9571716 | chr13 | 67711344 | TMEM55B | 90809 | 0.14 | trans |
Section II. Transcriptome annotation
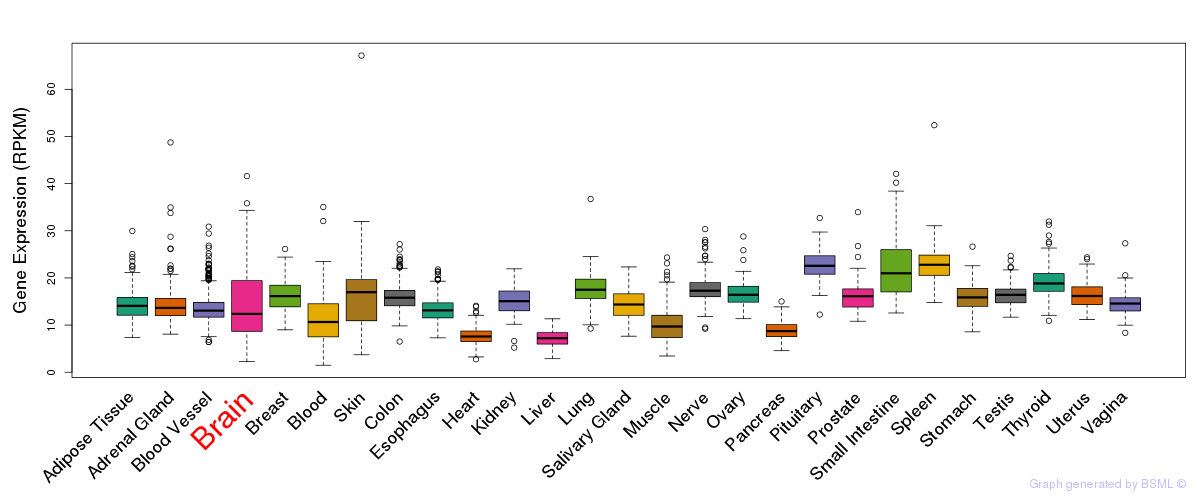
General gene expression (GTEx)
Gene expression during devlopment (BrainCloud)
Footnote:
A total of 269 time points ploted, with n=38 fetal samples (x=1:38). Each triangle represents one time point.
Gene expression of temporal and spatial changes (BrainSpan)
Footnote:
SC: sub-cortical regions; SM: sensory-motor regions; FC: frontal cortex; and TP: temporal-parietal cortex
ST1: fetal (13 - 26 postconception weeks), ST2: early infancy to late childhood (4 months to 11 years), and ST3: adolescence to adulthood (13 - 23 years)
The bar shown representes the lower 25% and upper 25% of the expression distribution.
No co-expressed genes in brain regions
Section III. Gene Ontology annotation
| Molecular function | GO term | Evidence | Neuro keywords | PubMed ID |
|---|---|---|---|---|
| GO:0016787 | hydrolase activity | IEA | - | |
| Cellular component | GO term | Evidence | Neuro keywords | PubMed ID |
| GO:0005765 | lysosomal membrane | IEA | - | |
| GO:0005768 | endosome | IEA | - | |
| GO:0016020 | membrane | IEA | - | |
| GO:0016021 | integral to membrane | IEA | - | |
| GO:0031902 | late endosome membrane | IEA | - |
Section V. Pathway annotation
| Pathway name | Pathway size | # SZGR 2.0 genes in pathway | Info |
|---|---|---|---|
| SENESE HDAC3 TARGETS DN | 536 | 332 | All SZGR 2.0 genes in this pathway |
| DODD NASOPHARYNGEAL CARCINOMA UP | 1821 | 933 | All SZGR 2.0 genes in this pathway |
| JAERVINEN AMPLIFIED IN LARYNGEAL CANCER | 40 | 24 | All SZGR 2.0 genes in this pathway |
| BENPORATH NANOG TARGETS | 988 | 594 | All SZGR 2.0 genes in this pathway |
| BENPORATH SOX2 TARGETS | 734 | 436 | All SZGR 2.0 genes in this pathway |
| STARK PREFRONTAL CORTEX 22Q11 DELETION DN | 517 | 309 | All SZGR 2.0 genes in this pathway |
| CHIBA RESPONSE TO TSA | 50 | 31 | All SZGR 2.0 genes in this pathway |
| GRADE COLON VS RECTAL CANCER DN | 56 | 36 | All SZGR 2.0 genes in this pathway |
| YOSHIMURA MAPK8 TARGETS UP | 1305 | 895 | All SZGR 2.0 genes in this pathway |
| LINSLEY MIR16 TARGETS | 206 | 127 | All SZGR 2.0 genes in this pathway |
Section VI. microRNA annotation
| miRNA family | Target position | miRNA ID | miRNA seq | ||
|---|---|---|---|---|---|
| UTR start | UTR end | Match method | |||
| miR-1/206 | 327 | 334 | 1A,m8 | hsa-miR-1 | UGGAAUGUAAAGAAGUAUGUA |
| hsa-miR-206SZ | UGGAAUGUAAGGAAGUGUGUGG | ||||
| hsa-miR-613 | AGGAAUGUUCCUUCUUUGCC | ||||
| miR-142-3p | 50 | 56 | m8 | hsa-miR-142-3p | UGUAGUGUUUCCUACUUUAUGGA |
- SZ: miRNAs which differentially expressed in brain cortex of schizophrenia patients comparing with control samples using microarray. Click here to see the list of SZ related miRNAs.
- Brain: miRNAs which are expressed in brain based on miRNA microarray expression studies. Click here to see the list of brain related miRNAs.