Gene Page: FMNL3
Summary ?
| GeneID | 91010 |
| Symbol | FMNL3 |
| Synonyms | FHOD3|FRL2|WBP-3|WBP3 |
| Description | formin like 3 |
| Reference | MIM:616288|HGNC:HGNC:23698|Ensembl:ENSG00000161791|HPRD:17007|Vega:OTTHUMG00000169651 |
| Gene type | protein-coding |
| Map location | 12q13.12 |
| Pascal p-value | 0.06 |
| Fetal beta | 0.782 |
| DMG | 1 (# studies) |
| Support | G2Cdb.humanPSD G2Cdb.humanPSP CompositeSet |
Gene in Data Sources
| Gene set name | Method of gene set | Description | Info |
|---|---|---|---|
| CV:PGCnp | Genome-wide Association Study | GWAS | |
| DMG:Jaffe_2016 | Genome-wide DNA methylation analysis | This dataset includes 2,104 probes/CpGs associated with SZ patients (n=108) compared to 136 controls at Bonferroni-adjusted P < 0.05. | 1 |
| Expression | Meta-analysis of gene expression | P value: 1.435 |
Section I. Genetics and epigenetics annotation
 Differentially methylated gene
| Probe | Chromosome | Position | Nearest gene | P (dis) | Beta (dis) | FDR (dis) | Study |
|---|---|---|---|---|---|---|---|
| cg15087401 | 12 | 50100809 | FMNL3 | 7.75E-9 | -0.014 | 3.76E-6 | DMG:Jaffe_2016 |
Section II. Transcriptome annotation
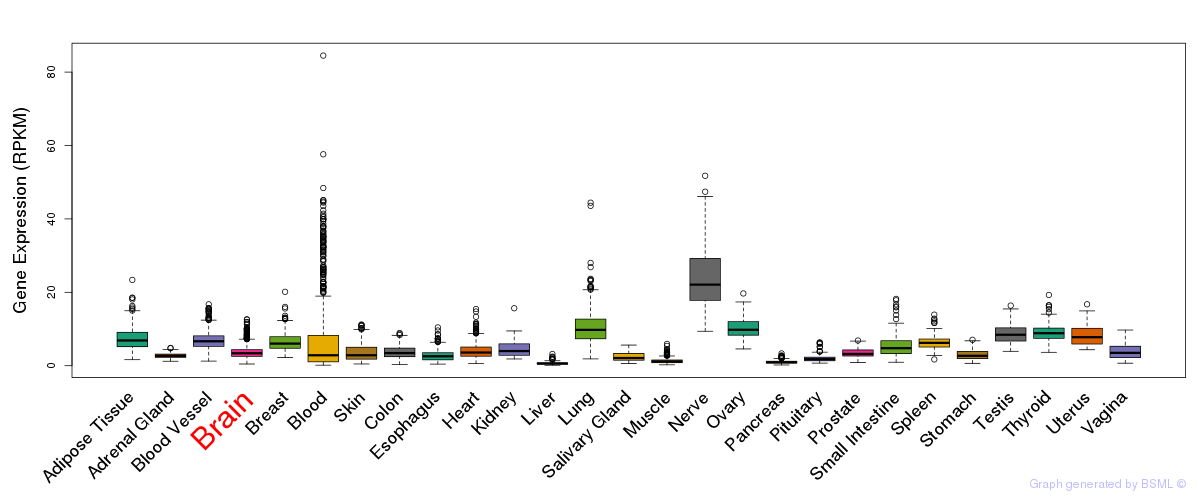
General gene expression (GTEx)
Gene expression during devlopment (BrainCloud)
Footnote:
A total of 269 time points ploted, with n=38 fetal samples (x=1:38). Each triangle represents one time point.
Gene expression of temporal and spatial changes (BrainSpan)
Footnote:
SC: sub-cortical regions; SM: sensory-motor regions; FC: frontal cortex; and TP: temporal-parietal cortex
ST1: fetal (13 - 26 postconception weeks), ST2: early infancy to late childhood (4 months to 11 years), and ST3: adolescence to adulthood (13 - 23 years)
The bar shown representes the lower 25% and upper 25% of the expression distribution.
No co-expressed genes in brain regions
Section III. Gene Ontology annotation
| Molecular function | GO term | Evidence | Neuro keywords | PubMed ID |
|---|---|---|---|---|
| GO:0003779 | actin binding | IEA | - | |
| GO:0005515 | protein binding | IEA | - | |
| GO:0017048 | Rho GTPase binding | IEA | - | |
| Biological process | GO term | Evidence | Neuro keywords | PubMed ID |
| GO:0016043 | cellular component organization | IEA | - | |
| GO:0030036 | actin cytoskeleton organization | IEA | - | |
| Cellular component | GO term | Evidence | Neuro keywords | PubMed ID |
| GO:0005794 | Golgi apparatus | IDA | 18029348 | |
| GO:0005737 | cytoplasm | IDA | 18029348 | |
| GO:0005886 | plasma membrane | IDA | 18029348 |
Section V. Pathway annotation
| Pathway name | Pathway size | # SZGR 2.0 genes in pathway | Info |
|---|---|---|---|
| RODRIGUES THYROID CARCINOMA POORLY DIFFERENTIATED DN | 805 | 505 | All SZGR 2.0 genes in this pathway |
| RODRIGUES THYROID CARCINOMA ANAPLASTIC DN | 537 | 339 | All SZGR 2.0 genes in this pathway |
| SHETH LIVER CANCER VS TXNIP LOSS PAM2 | 153 | 102 | All SZGR 2.0 genes in this pathway |
| CLAUS PGR POSITIVE MENINGIOMA DN | 12 | 10 | All SZGR 2.0 genes in this pathway |
| COLINA TARGETS OF 4EBP1 AND 4EBP2 | 356 | 214 | All SZGR 2.0 genes in this pathway |
| CHEN METABOLIC SYNDROM NETWORK | 1210 | 725 | All SZGR 2.0 genes in this pathway |
| GOBERT OLIGODENDROCYTE DIFFERENTIATION UP | 570 | 339 | All SZGR 2.0 genes in this pathway |
Section VI. microRNA annotation
| miRNA family | Target position | miRNA ID | miRNA seq | ||
|---|---|---|---|---|---|
| UTR start | UTR end | Match method | |||
| miR-148/152 | 1259 | 1265 | 1A | hsa-miR-148a | UCAGUGCACUACAGAACUUUGU |
| hsa-miR-152brain | UCAGUGCAUGACAGAACUUGGG | ||||
| hsa-miR-148b | UCAGUGCAUCACAGAACUUUGU | ||||
| miR-451 | 1840 | 1847 | 1A,m8 | hsa-miR-451brain | AAACCGUUACCAUUACUGAGUUU |
- SZ: miRNAs which differentially expressed in brain cortex of schizophrenia patients comparing with control samples using microarray. Click here to see the list of SZ related miRNAs.
- Brain: miRNAs which are expressed in brain based on miRNA microarray expression studies. Click here to see the list of brain related miRNAs.