Gene Page: OLFM2
Summary ?
| GeneID | 93145 |
| Symbol | OLFM2 |
| Synonyms | NOE2|NOELIN2|NOELIN2_V1|OlfC |
| Description | olfactomedin 2 |
| Reference | HGNC:HGNC:17189|Ensembl:ENSG00000105088|HPRD:10127|Vega:OTTHUMG00000180390 |
| Gene type | protein-coding |
| Map location | 19p13.2 |
| Pascal p-value | 0.482 |
| Fetal beta | -0.023 |
| DMG | 2 (# studies) |
| eGene | Cerebellum |
| Support | G2Cdb.humanPSD G2Cdb.humanPSP |
Gene in Data Sources
| Gene set name | Method of gene set | Description | Info |
|---|---|---|---|
| CV:PGCnp | Genome-wide Association Study | GWAS | |
| DMG:Jaffe_2016 | Genome-wide DNA methylation analysis | This dataset includes 2,104 probes/CpGs associated with SZ patients (n=108) compared to 136 controls at Bonferroni-adjusted P < 0.05. | 2 |
| DMG:Wockner_2014 | Genome-wide DNA methylation analysis | This dataset includes 4641 differentially methylated probes corresponding to 2929 unique genes between schizophrenia patients (n=24) and controls (n=24). | 2 |
Section I. Genetics and epigenetics annotation
 DNM table
| Gene | Chromosome | Position | Ref | Alt | Transcript | AA change | Mutation type | Sift | CG46 | Trait | Study |
|---|---|---|---|---|---|---|---|---|---|---|---|
| OLFM2 | chr19 | 9968042 | A | G | NM_058164 | . | silent | Schizophrenia | DNM:Fromer_2014 |
Differentially methylated gene
| Probe | Chromosome | Position | Nearest gene | P (dis) | Beta (dis) | FDR (dis) | Study |
|---|---|---|---|---|---|---|---|
| cg13604777 | 19 | 10047205 | OLFM2 | 3.68E-4 | -0.259 | 0.042 | DMG:Wockner_2014 |
| cg06549128 | 19 | 10047328 | OLFM2 | 7.51E-8 | -0.018 | 1.78E-5 | DMG:Jaffe_2016 |
Section II. Transcriptome annotation
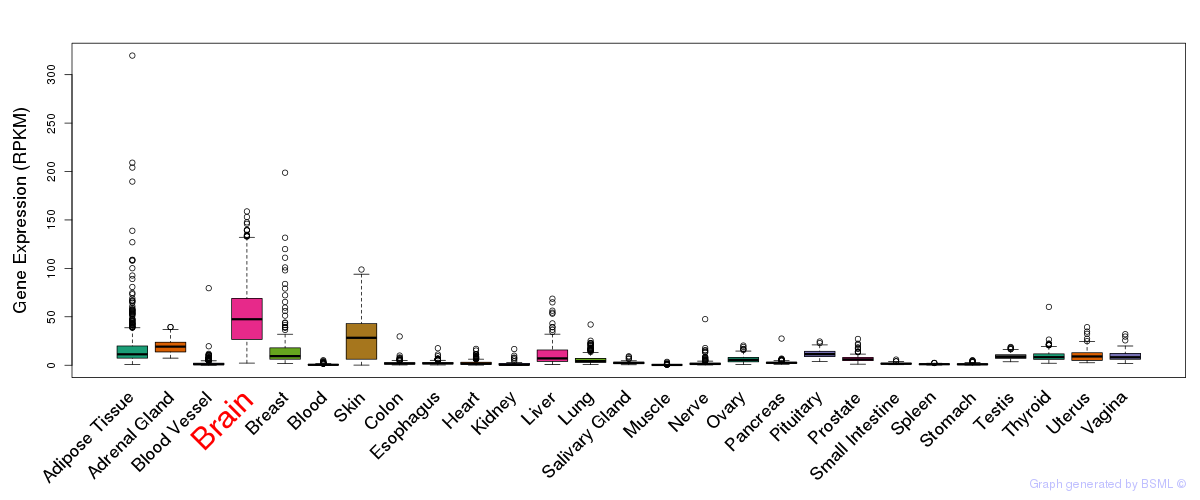
General gene expression (GTEx)
Gene expression during devlopment (BrainCloud)
Footnote:
A total of 269 time points ploted, with n=38 fetal samples (x=1:38). Each triangle represents one time point.
Gene expression of temporal and spatial changes (BrainSpan)
Footnote:
SC: sub-cortical regions; SM: sensory-motor regions; FC: frontal cortex; and TP: temporal-parietal cortex
ST1: fetal (13 - 26 postconception weeks), ST2: early infancy to late childhood (4 months to 11 years), and ST3: adolescence to adulthood (13 - 23 years)
The bar shown representes the lower 25% and upper 25% of the expression distribution.
No co-expressed genes in brain regions
Section V. Pathway annotation
| Pathway name | Pathway size | # SZGR 2.0 genes in pathway | Info |
|---|---|---|---|
| MEISSNER NPC HCP WITH H3 UNMETHYLATED | 536 | 296 | All SZGR 2.0 genes in this pathway |
| PLASARI TGFB1 TARGETS 10HR UP | 199 | 143 | All SZGR 2.0 genes in this pathway |